


Tornado Alley Refer to the accompanying frequency distribution that summarizes the number of tornadoes in Oklahoma in each year for the past several years. What is the class width? Is it possible to identify the original data values?
Ch. 2 - Exploring Data with Tables and Graphs
Chapter 2, Problem 2.r.2
Histogram of Interarrival Times Construct the histogram that corresponds to the frequency distribution from Exercise 1. Use class midpoint values for the horizontal scale. Does the histogram suggest that the data are from a population having a normal distribution? Why or why not?
Verified step by step guidance1
Step 1: Identify the frequency distribution from Exercise 1. Ensure you have the class intervals, frequencies, and calculate the class midpoints. The class midpoint for each interval is calculated as \( \text{Midpoint} = \frac{\text{Lower Bound} + \text{Upper Bound}}{2} \).
Step 2: Create a table that includes the class midpoints and their corresponding frequencies. This will serve as the basis for constructing the histogram.
Step 3: Plot the histogram using the class midpoints on the horizontal axis and the frequencies on the vertical axis. Each bar's height should correspond to the frequency of the respective class midpoint.
Step 4: Analyze the shape of the histogram. A normal distribution typically has a bell-shaped curve that is symmetric around the mean. Check if the histogram appears symmetric and if the frequencies decrease as you move away from the center.
Step 5: Conclude whether the data suggests a normal distribution based on the histogram's shape. If the histogram is approximately bell-shaped and symmetric, it may suggest normality. If it is skewed or has multiple peaks, it likely does not represent a normal distribution.

Verified video answer for a similar problem:
This video solution was recommended by our tutors as helpful for the problem above.
Video duration:
4mWas this helpful?
Key Concepts
Here are the essential concepts you must grasp in order to answer the question correctly.
Histogram
A histogram is a graphical representation of the distribution of numerical data, where the data is divided into intervals (bins) and the frequency of data points within each interval is represented by the height of bars. It helps visualize the shape, spread, and central tendency of the data, making it easier to identify patterns such as skewness or modality.
Recommended video:
Guided course
Intro to Histograms
Normal Distribution
A normal distribution is a continuous probability distribution characterized by its bell-shaped curve, where most of the observations cluster around the central peak and probabilities for values further away from the mean taper off symmetrically. Understanding this concept is crucial for determining if the data in the histogram aligns with the properties of a normal distribution.
Recommended video:
Guided course
Finding Standard Normal Probabilities using z-Table
Class Midpoint
The class midpoint is the value that lies in the middle of a class interval in a frequency distribution. It is calculated by averaging the upper and lower boundaries of the interval. Using class midpoints in a histogram allows for a more accurate representation of the data, as it provides a single value for each interval that can be plotted on the horizontal axis.
Recommended video:
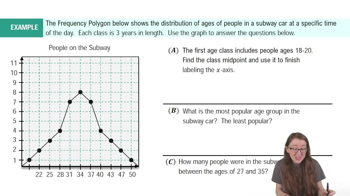
Frequency Polygons Example 1
Related Practice
Textbook Question
134
views
Textbook Question
In Exercises 21–24, find the coefficient of variation for each of the two samples; then compare the variation. (The same data were used in Section 3-1.)
Pulse Rates Listed below are pulse rates (beats per minute) from samples of adult males and females (from Data Set 1 “Body Data” in Appendix B). Does there appear to be a difference?
[IMAGE]
356
views
Textbook Question
Tornado Alley Using the same frequency distribution from Exercise 1, identify the class limits of the first class and the class boundaries of the first class.
141
views
Textbook Question
Tornado Alley Construct the relative frequency distribution corresponding to the frequency distribution in Exercise 1
146
views
