Table of contents
- 1. Introduction to Accounting1h 21m
- 2. Transaction Analysis1h 13m
- 3. Accrual Accounting Concepts2h 38m
- Accrual Accounting vs. Cash Basis Accounting10m
- Revenue Recognition and Expense Recognition24m
- Introduction to Adjusting Journal Entries and Prepaid Expenses36m
- Adjusting Entries: Supplies12m
- Adjusting Entries: Unearned Revenue11m
- Adjusting Entries: Accrued Expenses12m
- Adjusting Entries: Accrued Revenues6m
- Adjusting Entries: Depreciation16m
- Summary of Adjusting Entries7m
- Unadjusted vs Adjusted Trial Balance6m
- Closing Entries10m
- Post-Closing Trial Balance2m
- 4. Merchandising Operations2h 30m
- Service Company vs. Merchandising Company10m
- Net Sales28m
- Cost of Goods Sold - Perpetual Inventory vs. Periodic Inventory9m
- Perpetual Inventory - Purchases10m
- Perpetual Inventory - Freight Costs9m
- Perpetual Inventory - Purchase Discounts11m
- Perpetual Inventory - Purchasing Summary6m
- Periodic Inventory - Purchases14m
- Periodic Inventory - Freight Costs7m
- Periodic Inventory - Purchase Discounts10m
- Periodic Inventory - Purchasing Summary6m
- Single-step Income Statement4m
- Multi-step Income Statement17m
- Comprehensive Income2m
- 5. Inventory1h 55m
- Merchandising Company vs. Manufacturing Company6m
- Physical Inventory Count, Ownership of Goods, and Consigned Goods10m
- Specific Identification7m
- Periodic Inventory - FIFO, LIFO, and Average Cost23m
- Perpetual Inventory - FIFO, LIFO, and Average Cost31m
- Financial Statement Effects of Inventory Costing Methods10m
- Lower of Cost or Market11m
- Inventory Errors14m
- 6. Internal Controls and Reporting Cash1h 16m
- 7. Receivables and Investments3h 8m
- Types of Receivables8m
- Net Accounts Receivable: Direct Write-off Method5m
- Net Accounts Receivable: Allowance for Doubtful Accounts13m
- Net Accounts Receivable: Percentage of Sales Method9m
- Net Accounts Receivable: Aging of Receivables Method11m
- Notes Receivable25m
- Introduction to Investments in Securities13m
- Trading Securities31m
- Available-for-Sale (AFS) Securities26m
- Held-to-Maturity (HTM) Securities17m
- Equity Method25m
- 8. Long Lived Assets5h 2m
- Initial Cost of Long Lived Assets42m
- Basket (Lump-sum) Purchases13m
- Ordinary Repairs vs. Capital Improvements10m
- Depreciation: Straight Line32m
- Depreciation: Declining Balance29m
- Depreciation: Units-of-Activity28m
- Depreciation: Summary of Main Methods8m
- Depreciation for Partial Years13m
- Retirement of Plant Assets (No Proceeds)14m
- Sale of Plant Assets18m
- Change in Estimate: Depreciation21m
- Intangible Assets and Amortization17m
- Natural Resources and Depletion16m
- Asset Impairments16m
- Exchange for Similar Assets16m
- 9. Current Liabilities2h 19m
- 10. Time Value of Money1h 23m
- 11. Long Term Liabilities2h 45m
- 12. Stockholders' Equity2h 15m
- Characteristics of a Corporation17m
- Shares Authorized, Issued, and Outstanding9m
- Issuing Par Value Stock12m
- Issuing No Par Value Stock5m
- Issuing Common Stock for Assets or Services8m
- Retained Earnings14m
- Retained Earnings: Prior Period Adjustments9m
- Preferred Stock11m
- Treasury Stock9m
- Dividends and Dividend Preferences17m
- Stock Dividends10m
- Stock Splits9m
- 13. Statement of Cash Flows2h 24m
- 14. Financial Statement Analysis5h 25m
- Horizontal Analysis14m
- Vertical Analysis23m
- Common-sized Statements5m
- Trend Percentages7m
- Discontinued Operations and Extraordinary Items6m
- Introduction to Ratios8m
- Ratios: Earnings Per Share (EPS)10m
- Ratios: Working Capital and the Current Ratio14m
- Ratios: Quick (Acid Test) Ratio12m
- Ratios: Gross Profit Rate9m
- Ratios: Profit Margin7m
- Ratios: Quality of Earnings Ratio8m
- Ratios: Inventory Turnover10m
- Ratios: Average Days in Inventory9m
- Ratios: Accounts Receivable (AR) Turnover9m
- Ratios: Average Collection Period (Days Sales Outstanding)8m
- Ratios: Return on Assets (ROA)8m
- Ratios: Total Asset Turnover5m
- Ratios: Fixed Asset Turnover5m
- Ratios: Profit Margin x Asset Turnover = Return On Assets9m
- Ratios: Accounts Payable Turnover6m
- Ratios: Days Payable Outstanding (DPO)8m
- Ratios: Times Interest Earned (TIE)7m
- Ratios: Debt to Asset Ratio5m
- Ratios: Debt to Equity Ratio5m
- Ratios: Payout Ratio5m
- Ratios: Dividend Yield Ratio7m
- Ratios: Return on Equity (ROE)10m
- Ratios: DuPont Model for Return on Equity (ROE)20m
- Ratios: Free Cash Flow10m
- Ratios: Price-Earnings Ratio (PE Ratio)7m
- Ratios: Book Value per Share of Common Stock7m
- Ratios: Cash to Monthly Cash Expenses8m
- Ratios: Cash Return on Assets7m
- Ratios: Economic Return from Investing6m
- Ratios: Capital Acquisition Ratio6m
- 15. GAAP vs IFRS56m
- GAAP vs. IFRS: Introduction7m
- GAAP vs. IFRS: Classified Balance Sheet6m
- GAAP vs. IFRS: Recording Differences4m
- GAAP vs. IFRS: Adjusting Entries4m
- GAAP vs. IFRS: Merchandising3m
- GAAP vs. IFRS: Inventory3m
- GAAP vs. IFRS: Fraud, Internal Controls, and Cash3m
- GAAP vs. IFRS: Receivables2m
- GAAP vs. IFRS: Long Lived Assets5m
- GAAP vs. IFRS: Liabilities3m
- GAAP vs. IFRS: Stockholders' Equity3m
- GAAP vs. IFRS: Statement of Cash Flows5m
- GAAP vs. IFRS: Analysis and Income Statement Presentation5m
14. Financial Statement Analysis
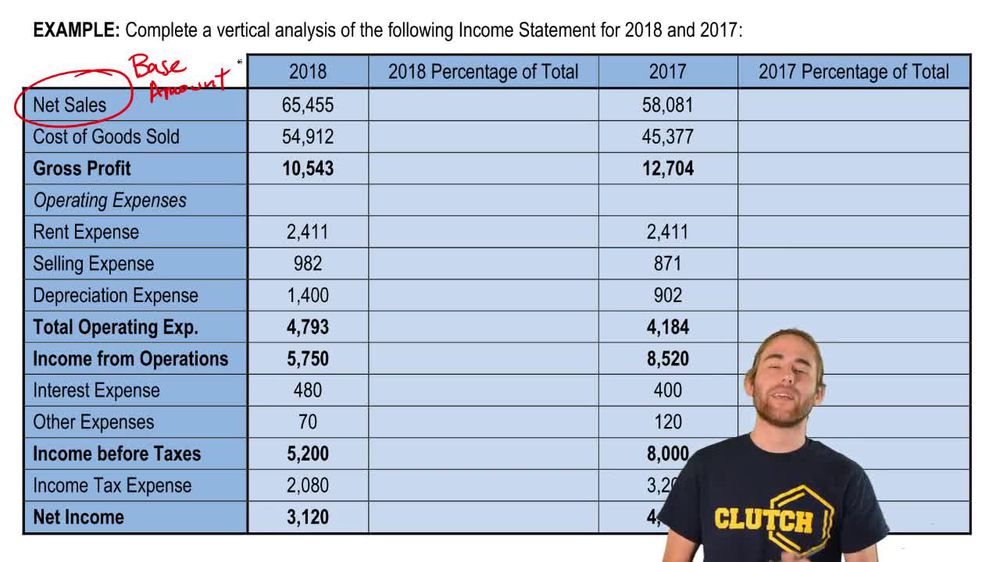
Vertical Analysis


Vertical Analysis
Brian Krogol
Video duration:
4mPlay a video:
Related Videos
Related Practice
 08:09
08:09