Textbook Question
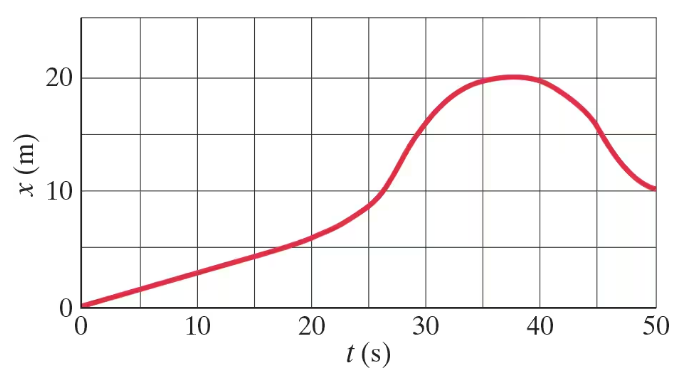
The position of an object along a straight tunnel as a function of time is plotted in Fig. 2–40. What is its average velocity between t = 0 and t = 5.0 s?794views
Textbook Question(II) In Fig. 2–40, during what time intervals, if any, is the velocity constant?966views
Textbook QuestionFigure 2–55 shows the position vs. time graph for two bicycles, A and B. Identify any instant at which the two bicycles have the same velocity.964views
Textbook QuestionFigure 2–55 shows the position vs. time graph for two bicycles, A and B. Which bicycle has the larger acceleration?911views
Textbook QuestionFIGURE EX1.18 shows the motion diagram of a drag racer. The camera took one frame every 2 s. Make a position-versus-time graph for the drag racer. Because you have data only at certain instants, your graph should consist of dots that are not connected together.1134views
Textbook QuestionFIGURE EX2.4 is the position-versus-time graph of a bicycle. What is the bicycle's velocity at t = 5s1371views