16. Statistics in Psychology
Frequency Distributions
Multiple Choice
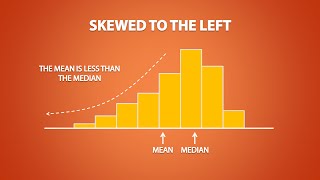
Multiple ChoiceDr. Sardonicus gave an exceptionally easy exam to her Introductory Psychology students. As such, virtually every student got an 'A' on the test. When Dr. Sardonicus plotted the scores for the 100 students in her class in a frequency polygon, she found very few scores on the left side of the graph (Ds and Fs) and a great many scores on the right side of the graph (As and Bs). 'Huh,' she said aloud, to no one in particular. 'Whaddya know; I 've got a _________ distribution.'
A
positively skewed
B
normal
C
bimodal
D
negatively skewed
192
views
Related Videos
Related Practice
 05:13
05:13


Showing 1 of 8 videos