What does it mean to say that the linear correlation coefficient between two variables equals 1? What would the scatter diagram look like?
Table of contents
- 1. Intro to Stats and Collecting Data1h 14m
- 2. Describing Data with Tables and Graphs1h 55m
- 3. Describing Data Numerically2h 5m
- 4. Probability2h 16m
- 5. Binomial Distribution & Discrete Random Variables3h 6m
- 6. Normal Distribution and Continuous Random Variables2h 11m
- 7. Sampling Distributions & Confidence Intervals: Mean3h 23m
- Sampling Distribution of the Sample Mean and Central Limit Theorem19m
- Distribution of Sample Mean - Excel23m
- Introduction to Confidence Intervals15m
- Confidence Intervals for Population Mean1h 18m
- Determining the Minimum Sample Size Required12m
- Finding Probabilities and T Critical Values - Excel28m
- Confidence Intervals for Population Means - Excel25m
- 8. Sampling Distributions & Confidence Intervals: Proportion2h 10m
- 9. Hypothesis Testing for One Sample5h 9m
- Steps in Hypothesis Testing1h 6m
- Performing Hypothesis Tests: Means1h 4m
- Hypothesis Testing: Means - Excel42m
- Performing Hypothesis Tests: Proportions37m
- Hypothesis Testing: Proportions - Excel27m
- Performing Hypothesis Tests: Variance12m
- Critical Values and Rejection Regions28m
- Link Between Confidence Intervals and Hypothesis Testing12m
- Type I & Type II Errors17m
- 10. Hypothesis Testing for Two Samples5h 37m
- Two Proportions1h 13m
- Two Proportions Hypothesis Test - Excel28m
- Two Means - Unknown, Unequal Variance1h 3m
- Two Means - Unknown Variances Hypothesis Test - Excel12m
- Two Means - Unknown, Equal Variance15m
- Two Means - Unknown, Equal Variances Hypothesis Test - Excel9m
- Two Means - Known Variance12m
- Two Means - Sigma Known Hypothesis Test - Excel21m
- Two Means - Matched Pairs (Dependent Samples)42m
- Matched Pairs Hypothesis Test - Excel12m
- Two Variances and F Distribution29m
- Two Variances - Graphing Calculator16m
- 11. Correlation1h 24m
- 12. Regression3h 33m
- Linear Regression & Least Squares Method26m
- Residuals12m
- Coefficient of Determination12m
- Regression Line Equation and Coefficient of Determination - Excel8m
- Finding Residuals and Creating Residual Plots - Excel11m
- Inferences for Slope31m
- Enabling Data Analysis Toolpak1m
- Regression Readout of the Data Analysis Toolpak - Excel21m
- Prediction Intervals13m
- Prediction Intervals - Excel19m
- Multiple Regression - Excel29m
- Quadratic Regression15m
- Quadratic Regression - Excel10m
- 13. Chi-Square Tests & Goodness of Fit2h 21m
- 14. ANOVA1h 57m
11. Correlation
Correlation Coefficient
Problem 11.3.24b
Textbook Question
[DATA] Graduation Rates PayScale reports statistics on colleges and universities. Go to www.pearsonhighered.com/sullivanstats to obtain the data file 11_3_24 using the file format of your choice for the version of the text you are using. The data contain the four-year cost and graduation rate for over 1300 colleges and universities. Do schools that charge more have higher graduation rates? The variable “4 Year Cost” represents the four-year cost of attending the college or university. The variable “Grad Rate” represents the percentage of incoming freshman who graduate within six years.
b. Determine the correlation coefficient between “4 Year Cost” and “Grad Rate.”
Verified step by step guidance1
Identify the two variables involved: "4 Year Cost" (the four-year cost of attending the college) and "Grad Rate" (the percentage of incoming freshmen who graduate within six years).
Organize the data into pairs \((x_i, y_i)\), where \(x_i\) represents the "4 Year Cost" for the \(i^{th}\) college and \(y_i\) represents the corresponding "Grad Rate."
Calculate the mean of each variable: \(\bar{x} = \frac{1}{n} \sum_{i=1}^n x_i\) and \(\bar{y} = \frac{1}{n} \sum_{i=1}^n y_i\), where \(n\) is the number of colleges.
Compute the covariance between the two variables using the formula:
\[\text{Cov}(X,Y) = \frac{1}{n-1} \sum_{i=1}^n (x_i - \bar{x})(y_i - \bar{y})\]
Calculate the standard deviations of each variable:
\[s_x = \sqrt{\frac{1}{n-1} \sum_{i=1}^n (x_i - \bar{x})^2} \quad \text{and} \quad s_y = \sqrt{\frac{1}{n-1} \sum_{i=1}^n (y_i - \bar{y})^2}\]
Finally, find the correlation coefficient \(r\) using the formula:
\[r = \frac{\text{Cov}(X,Y)}{s_x s_y}\]
This value measures the strength and direction of the linear relationship between "4 Year Cost" and "Grad Rate."
Verified video answer for a similar problem:
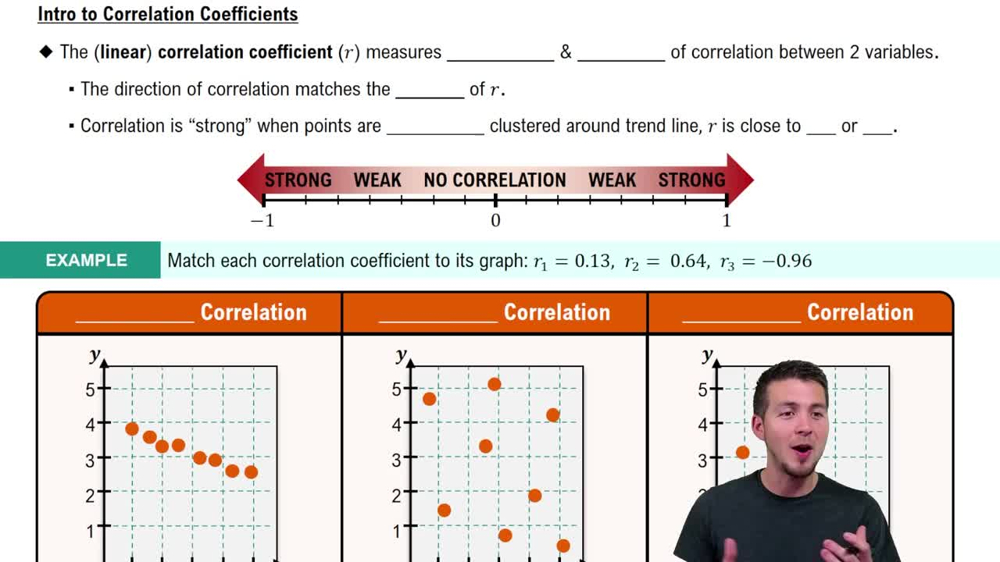
This video solution was recommended by our tutors as helpful for the problem above
Video duration:
3mPlay a video:
Was this helpful?
Key Concepts
Here are the essential concepts you must grasp in order to answer the question correctly.
Correlation Coefficient
The correlation coefficient measures the strength and direction of a linear relationship between two quantitative variables. It ranges from -1 to 1, where values close to 1 indicate a strong positive relationship, values close to -1 indicate a strong negative relationship, and values near 0 suggest no linear association.
Recommended video:
Guided course
Correlation Coefficient
Variables and Data Interpretation
Understanding the variables involved is crucial: '4 Year Cost' represents the total cost to attend a college for four years, and 'Grad Rate' is the percentage of students graduating within six years. Interpreting these correctly helps in analyzing how cost might relate to graduation success.
Recommended video:
Introduction to Collecting Data
Data Analysis Using Statistical Software or Tools
Calculating the correlation coefficient typically requires statistical software or tools that can handle large datasets. Familiarity with importing data, selecting variables, and running correlation functions is essential to accurately compute and interpret the relationship.
Recommended video:
Guided course
Find 5-Number Summary - TI-84 Calculator
Watch next
Master Correlation Coefficient with a bite sized video explanation from Patrick
Start learningRelated Videos
Related Practice
Textbook Question
36
views
