Stating Hypotheses In Exercises 11–16, the statement represents a claim. Write its complement and state which is H0 and which is Ha.
σ^2 ≥ 1.2
Verified step by step guidance
1
Understand the problem: The claim is about the population variance (σ²) being greater than or equal to 1.2. In hypothesis testing, we need to write the null hypothesis (H₀) and the alternative hypothesis (Hₐ). The null hypothesis typically represents the status quo or the claim being tested, while the alternative hypothesis represents the complement of the claim.
Write the null hypothesis (H₀): The null hypothesis is the statement that includes the equality part of the claim. In this case, the claim is σ² ≥ 1.2, so the null hypothesis is H₀: σ² ≥ 1.2.
Write the alternative hypothesis (Hₐ): The alternative hypothesis is the complement of the null hypothesis. Since the null hypothesis is H₀: σ² ≥ 1.2, the complement is that the population variance is less than 1.2. Therefore, the alternative hypothesis is Hₐ: σ² < 1.2.
Verify the roles of H₀ and Hₐ: The null hypothesis (H₀) is the statement we assume to be true unless there is strong evidence against it. The alternative hypothesis (Hₐ) is what we are trying to find evidence for. In this case, H₀: σ² ≥ 1.2 and Hₐ: σ² < 1.2 are correctly assigned.
Summarize the hypotheses: The null hypothesis is H₀: σ² ≥ 1.2, and the alternative hypothesis is Hₐ: σ² < 1.2. These hypotheses are now ready to be used in a hypothesis test.
Verified video answer for a similar problem:
This video solution was recommended by our tutors as helpful for the problem above
Video duration:
1m
Play a video:
0 Comments
Key Concepts
Here are the essential concepts you must grasp in order to answer the question correctly.
Hypothesis Testing
Hypothesis testing is a statistical method used to make decisions about a population based on sample data. It involves formulating two competing hypotheses: the null hypothesis (H0), which represents a statement of no effect or no difference, and the alternative hypothesis (Ha), which represents the claim being tested. The goal is to determine whether there is enough evidence to reject H0 in favor of Ha.
The null hypothesis (H0) is a statement that indicates no significant effect or relationship exists in the population, serving as a baseline for comparison. The alternative hypothesis (Ha) is the statement that reflects the claim or effect that the researcher aims to support. In the context of the given statement, H0 would be σ^2 < 1.2, while Ha would be σ^2 ≥ 1.2.
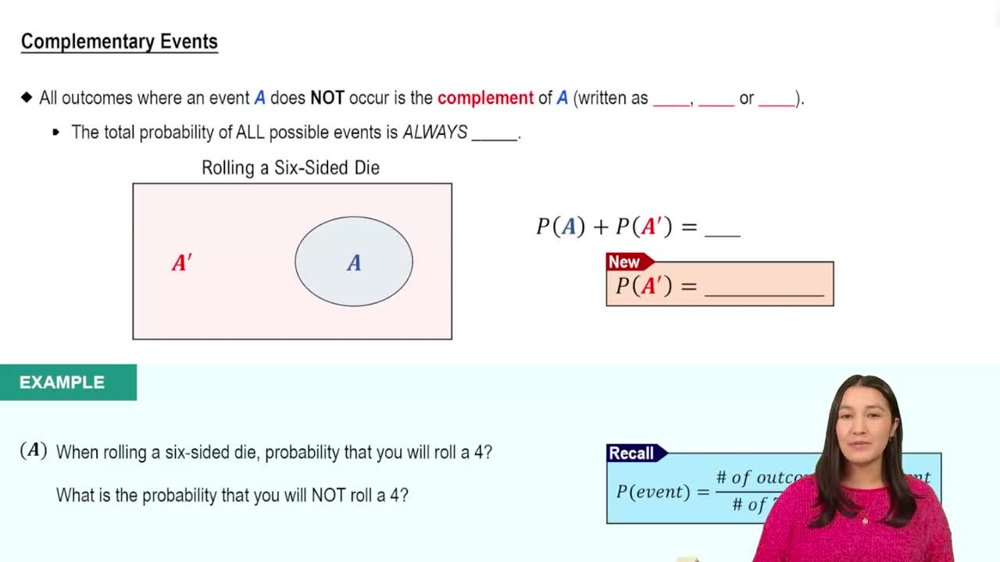
The complement of a hypothesis refers to the opposite scenario of the original claim. In hypothesis testing, if the original claim is that a parameter is greater than or equal to a certain value, its complement would state that the parameter is less than that value. This is crucial for defining the null hypothesis, as it allows for a clear distinction between what is being tested and what is assumed to be true under the null.

 Verified step by step guidance
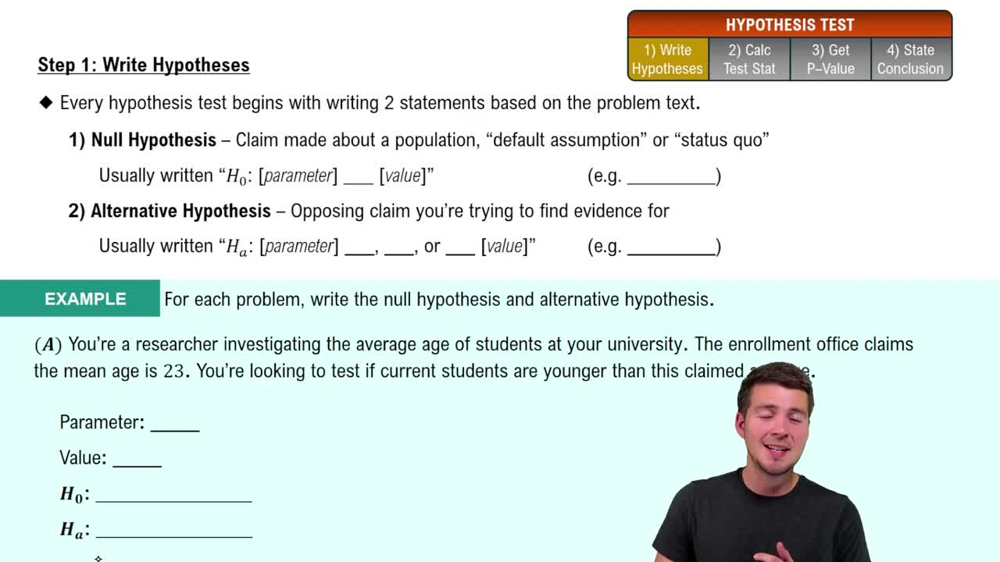
 06:21
06:21