Ch. 7 - Hypothesis Testing with One Sample
Larson - Elementary Statistics: Picturing the World 8th Edition
Larson8th EditionElementary Statistics: Picturing the WorldISBN: 9780137493470Not the one you use?Change textbook
Chapter 7, Problem 7.1.15

Stating Hypotheses In Exercises 11–16, the statement represents a claim. Write its complement and state which is H0 and which is Ha.


p < 0.45

Verified step by step guidance
1
Step 1: Understand the problem. The problem involves writing the complement of the given claim and identifying which hypothesis is the null hypothesis (H0) and which is the alternative hypothesis (Ha). The given claim is 'p < 0.45', where 'p' represents the population proportion.
Step 2: Recall the definitions of hypotheses. The null hypothesis (H0) is a statement of no effect or no difference and typically includes equality (e.g., '=', '≥', or '≤'). The alternative hypothesis (Ha) is the claim being tested and represents a statement of inequality (e.g., '≠', '<', or '>').
Step 3: Write the complement of the given claim. The complement of 'p < 0.45' is 'p ≥ 0.45'. This is because the complement includes all values of 'p' that are not less than 0.45.
Step 4: Assign the hypotheses. The null hypothesis (H0) is the complement of the claim, so H0: p ≥ 0.45. The alternative hypothesis (Ha) is the original claim, so Ha: p < 0.45.
Step 5: Finalize the hypotheses. The null hypothesis (H0) is H0: p ≥ 0.45, and the alternative hypothesis (Ha) is Ha: p < 0.45. These hypotheses are now ready to be used in a hypothesis test.

Verified video answer for a similar problem:

This video solution was recommended by our tutors as helpful for the problem above.
Video duration:
1m
Was this helpful?

Key Concepts

Here are the essential concepts you must grasp in order to answer the question correctly.

Hypothesis Testing

Hypothesis testing is a statistical method used to make decisions about a population based on sample data. It involves formulating two competing hypotheses: the null hypothesis (H0), which represents a statement of no effect or no difference, and the alternative hypothesis (Ha), which represents the claim being tested. The goal is to determine whether there is enough evidence to reject H0 in favor of Ha.
Recommended video:
Guided course
06:21
Step 1: Write Hypotheses

Null and Alternative Hypotheses

The null hypothesis (H0) is a statement that indicates no significant difference or effect exists in the context of the study. In contrast, the alternative hypothesis (Ha) represents the claim that there is a significant difference or effect. For the given statement 'p < 0.45', H0 would typically be 'p ≥ 0.45', while Ha would be 'p < 0.45'.
Recommended video:
Guided course
06:21
Step 1: Write Hypotheses

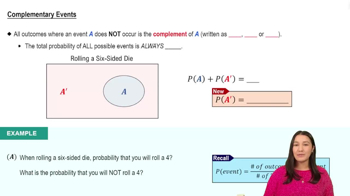
Complement of a Hypothesis

The complement of a hypothesis refers to the opposite scenario of the original claim. In hypothesis testing, if the original claim is that a parameter is less than a certain value (e.g., p < 0.45), the complement would state that the parameter is greater than or equal to that value (e.g., p ≥ 0.45). Understanding the complement is crucial for correctly formulating H0 and Ha.
Recommended video:
4:23
Complementary Events
Related Practice
Textbook Question

Stating the Null and Alternative Hypotheses In Exercises 25–30, write the claim as a mathematical statement. State the null and alternative hypotheses, and identify which represents the claim.


Base Price of an ATV The standard deviation of the base price of an all-terrain vehicle is no more than \$320.

89
views
Textbook Question

Hypothesis Testing Using Rejection Region(s) In Exercises 39–44, (a) identify the claim and state H0 and Ha, (b) find the critical value(s) and identify the rejection region(s), (c) find the standardized test statistic z, (d) decide whether to reject or fail to reject the null hypothesis, and (e) interpret the decision in the context of the original claim.


[APPLET] Gross Domestic Product A politician estimates that the mean gross domestic product (GDP) per country in a recent year is greater than \$400 billion. You want to test this estimate. To do so, you determine the GDPs of 42 randomly selected countries for that year. The results (in billions of dollars) are shown in the table at the left. Assume the population standard deviation is \$2099 billion. At alpha=0.06, can you support the politician’s estimate?


64
views
Textbook Question

Stating Hypotheses In Exercises 11–16, the statement represents a claim. Write its complement and state which is H0 and which is Ha.


σ ≠ 5

49
views
Textbook Question

In Exercises 7–12, find the critical value(s) and rejection region(s) for the type of chi-square test with sample size n and level of significance α.


Two-tailed test, n=81,α=0.10

78
views
Textbook Question

In Exercises 13–18, test the claim about the population mean μ at the level of significance α. Assume the population is normally distributed.

Claim: μ≥8000; α=0.01. Sample statistics: x_bar=77,000, s=450, n=25

77
views
Textbook Question

Graphical Analysis In Exercises 9–12, match the P-value or z-statistic with the graph that represents the corresponding area. Explain your reasoning.


z = -2.37


61
views