Threaded Problem: Tornado The data set “Tornadoes_2017” located at www.pearsonhighered.com/sullivanstats contains a variety of variables that were measured for all tornadoes in the United States in 2017. b. Estimate the difference in the length of tornadoes that occur in Texas and Georgia (compute the difference in means as Georgia – Texas) with 95% confidence. Interpret the result.
Verified step by step guidance
1
Identify the two groups for comparison: tornado lengths in Texas and tornado lengths in Georgia from the data set "Tornadoes_2017."
Calculate the sample mean length for tornadoes in Georgia, denoted as \(\bar{x}_{Georgia}\), and the sample mean length for tornadoes in Texas, denoted as \(\bar{x}_{Texas}\).
Calculate the sample standard deviations for tornado lengths in both states, denoted as \(s_{Georgia}\) and \(s_{Texas}\), and determine the sample sizes \(n_{Georgia}\) and \(n_{Texas}\).
Compute the standard error (SE) of the difference between the two means using the formula:
\[SE = \sqrt{\frac{s_{Georgia}^2}{n_{Georgia}} + \frac{s_{Texas}^2}{n_{Texas}}}\]
Find the appropriate critical value \(t^*\) for a 95% confidence level based on the degrees of freedom (which can be approximated using the Welch-Satterthwaite equation if variances are unequal). Then construct the confidence interval for the difference in means (Georgia - Texas) as:
\[\left( (\bar{x}_{Georgia} - \bar{x}_{Texas}) - t^* \times SE, \quad (\bar{x}_{Georgia} - \bar{x}_{Texas}) + t^* \times SE \right)\]
Interpret this interval as the range of plausible values for the true difference in average tornado lengths between Georgia and Texas with 95% confidence.
Verified video answer for a similar problem:
This video solution was recommended by our tutors as helpful for the problem above
Video duration:
2m
Play a video:
0 Comments
Key Concepts
Here are the essential concepts you must grasp in order to answer the question correctly.
Confidence Interval for Difference of Means
A confidence interval for the difference of means estimates the range within which the true difference between two population means lies, with a specified level of confidence (e.g., 95%). It accounts for sample variability and provides an interval rather than a single point estimate, helping to assess if the difference is statistically significant.
The sampling distribution of the difference between sample means describes how the difference varies from sample to sample. The standard error measures the variability of this difference and is used to calculate the confidence interval, reflecting the precision of the estimate.
Interpreting a confidence interval involves understanding that, if the interval does not include zero, there is evidence of a significant difference between groups. The interval's range indicates plausible values for the difference, and the confidence level (e.g., 95%) expresses the degree of certainty in this estimation.

 Verified step by step guidance
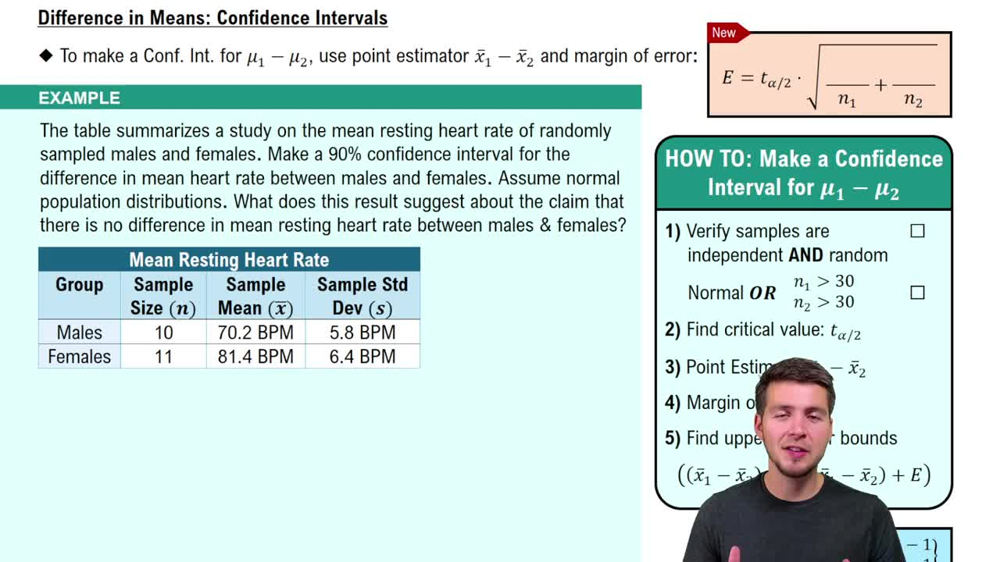
 08:21
08:21