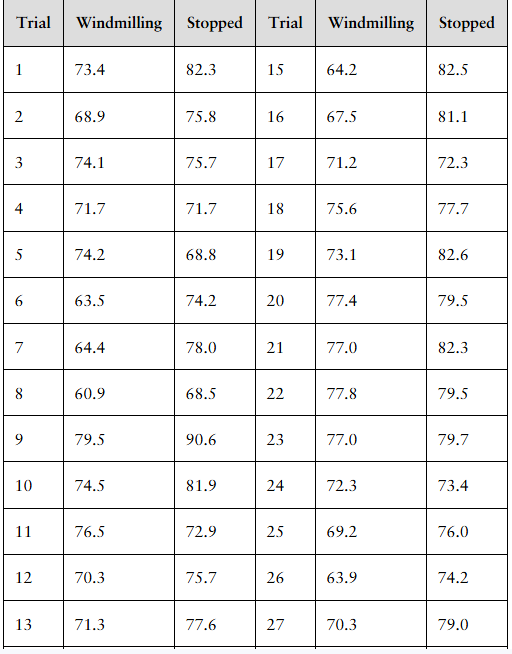
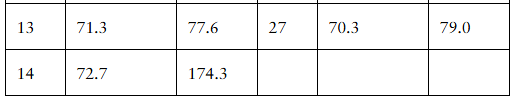
[DATA] Putting It Together: Glide Testing You are a passenger in a single-propeller-driven aircraft that experiences engine failure in the middle of a flight. The pilot wants to maximize the distance that the plane can glide to increase the likelihood of finding a safe place to land. To accomplish this goal, should the pilot allow the propeller to “windmill” or should the pilot force the propeller to stop? To obtain the data needed to answer the research question, a pilot climbed to 8000 feet at a speed of 60 knots and then killed the engine with the propeller either windmilling or stopped. Because the time to descend is directly proportional to glide distance, the time to descend to 7200 feet was recorded in seconds and used as a proxy for glide distance. The design called for randomly choosing the order in which the propeller would windmill or be stopped. The data in the table represent the time to descend 800 feet for each of 27 trials. Note: Visit www.aceaerobaticschool.com to see footage of this scenario. d. What is the response variable in the study? What are the treatments?
Verified step by step guidance
1
Step 1: Identify the response variable. The response variable is the outcome that is measured in the study to assess the effect of the treatments. In this case, the response variable is the time to descend 800 feet, measured in seconds, which serves as a proxy for glide distance.
Step 2: Identify the treatments. Treatments are the different conditions or groups that are applied to the experimental units to observe their effect on the response variable. Here, the treatments are the two propeller conditions: 'Windmilling' and 'Stopped'.
Step 3: Understand the experimental design. Each trial records the time to descend 800 feet under both treatments, allowing comparison of the glide performance between the windmilling propeller and the stopped propeller conditions.
Step 4: Summarize the variables. So, the response variable is the 'time to descend 800 feet (seconds)', and the treatments are the two propeller states: 'Windmilling' and 'Stopped'.
Step 5: Recognize the purpose of the study. The goal is to determine which propeller condition maximizes glide distance, inferred from the descent time, by comparing the response variable across the two treatments.
Verified video answer for a similar problem:
This video solution was recommended by our tutors as helpful for the problem above
Video duration:
1m
Play a video:
0 Comments
Key Concepts
Here are the essential concepts you must grasp in order to answer the question correctly.
Response Variable
The response variable is the outcome measured in an experiment to assess the effect of treatments. In this study, it is the time to descend 800 feet, recorded in seconds, which serves as a proxy for glide distance. This variable reflects how long the plane takes to descend under different propeller conditions.
Intro to Random Variables & Probability Distributions
Treatments
Treatments are the different conditions or interventions applied to experimental units to observe their effects. Here, the treatments are the two propeller conditions: allowing the propeller to windmill versus forcing the propeller to stop. These treatments are compared to determine which maximizes glide distance.
Randomization involves randomly assigning the order of treatments to reduce bias and ensure valid comparisons. In this study, the order of windmilling or stopped propeller conditions was randomly chosen for each trial, helping to control for confounding variables and improve the reliability of the results.

 Verified step by step guidance
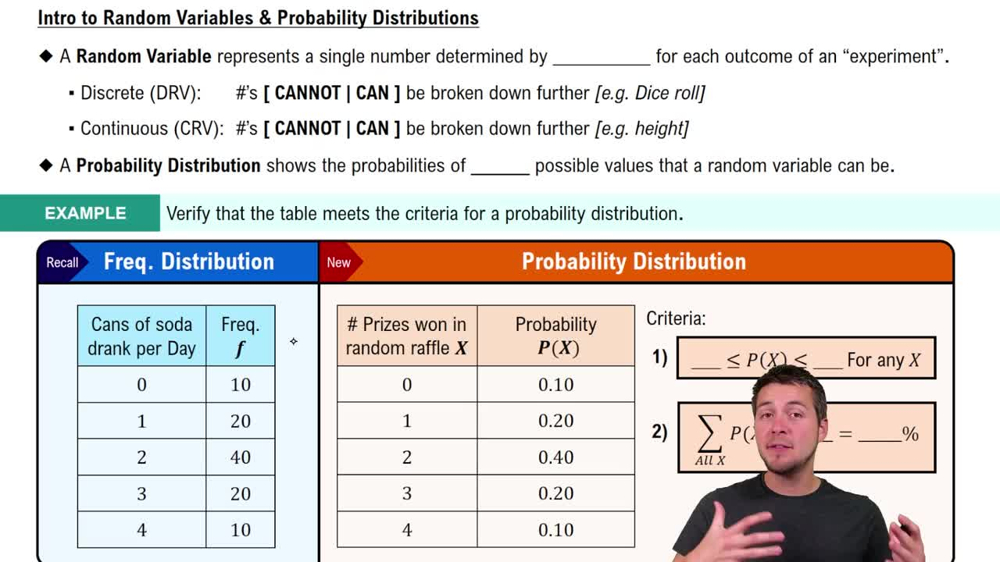
 07:09
07:09