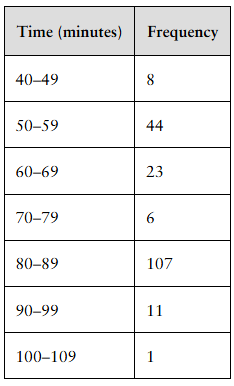
Download Time A histogram of the download time of a movie, in minutes, for 30 randomly selected movies is shown. The mean download time is 39.007 minutes and the median download time is 39.065 minutes. Identify the shape of the distribution. Which measure of central tendency better describes the “center” of the distribution?
Table of contents
- 1. Intro to Stats and Collecting Data1h 14m
- 2. Describing Data with Tables and Graphs1h 55m
- 3. Describing Data Numerically2h 5m
- 4. Probability2h 16m
- 5. Binomial Distribution & Discrete Random Variables3h 6m
- 6. Normal Distribution and Continuous Random Variables2h 11m
- 7. Sampling Distributions & Confidence Intervals: Mean3h 23m
- Sampling Distribution of the Sample Mean and Central Limit Theorem19m
- Distribution of Sample Mean - Excel23m
- Introduction to Confidence Intervals15m
- Confidence Intervals for Population Mean1h 18m
- Determining the Minimum Sample Size Required12m
- Finding Probabilities and T Critical Values - Excel28m
- Confidence Intervals for Population Means - Excel25m
- 8. Sampling Distributions & Confidence Intervals: Proportion1h 25m
- 9. Hypothesis Testing for One Sample3h 29m
- 10. Hypothesis Testing for Two Samples4h 50m
- Two Proportions1h 13m
- Two Proportions Hypothesis Test - Excel28m
- Two Means - Unknown, Unequal Variance1h 3m
- Two Means - Unknown Variances Hypothesis Test - Excel12m
- Two Means - Unknown, Equal Variance15m
- Two Means - Unknown, Equal Variances Hypothesis Test - Excel9m
- Two Means - Known Variance12m
- Two Means - Sigma Known Hypothesis Test - Excel21m
- Two Means - Matched Pairs (Dependent Samples)42m
- Matched Pairs Hypothesis Test - Excel12m
- 11. Correlation1h 24m
- 12. Regression1h 50m
- 13. Chi-Square Tests & Goodness of Fit2h 21m
- 14. ANOVA1h 57m
3. Describing Data Numerically
Mean
Problem 3.T.6a
Textbook Question
The following data represent the length of time (in minutes) between eruptions of Old Faithful in Yellowstone National Park.
a. Approximate the mean length of time between eruptions. .

Verified step by step guidance1
Step 1: Identify the midpoints of each class interval. The midpoint is found by averaging the lower and upper bounds of each interval. For example, for the interval 40-49, the midpoint is calculated as \(\frac{40 + 49}{2}\).
Step 2: Multiply each midpoint by its corresponding frequency to find the total contribution of each class to the overall sum. This means calculating \(\text{midpoint} \times \text{frequency}\) for each class.
Step 3: Sum all the products obtained in Step 2 to get the total weighted sum of all time intervals.
Step 4: Sum all the frequencies to find the total number of observations.
Step 5: Calculate the approximate mean length of time between eruptions by dividing the total weighted sum by the total frequency using the formula: \(\text{Mean} = \frac{\sum (\text{midpoint} \times \text{frequency})}{\sum \text{frequency}}\).
Verified video answer for a similar problem:This video solution was recommended by our tutors as helpful for the problem above
Video duration:
1mPlay a video:
Was this helpful?
Key Concepts
Here are the essential concepts you must grasp in order to answer the question correctly.
Grouped Data and Class Intervals
Grouped data is data organized into intervals or classes, each with a frequency indicating how many observations fall within that range. Understanding class intervals helps in summarizing large data sets and is essential for calculating measures like the mean when individual data points are unavailable.
Recommended video:
Introduction to Collecting Data
Midpoint of Class Intervals
The midpoint of a class interval is the value halfway between the lower and upper boundaries of the interval. It serves as a representative value for all data points in that class, allowing approximation of statistics such as the mean when only grouped data is available.
Recommended video:
Guided course
Prediction Intervals
Calculating the Mean from Grouped Data
To approximate the mean from grouped data, multiply each class midpoint by its frequency, sum these products, and then divide by the total number of observations. This weighted average provides an estimate of the central tendency when raw data points are not accessible.
Recommended video:
Guided course
Calculating the Mean
Watch next
Master Calculating the Mean with a bite sized video explanation from Patrick
Start learningRelated Videos
Related Practice
Textbook Question
14
views
