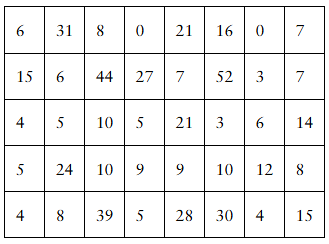
[DATA] Wait Time The following data represent the wait time (in minutes) for a random sample of 40 visitors to Disney’s Dinosaur Ride in Animal Kingdom. a. Determine and interpret the quartiles. b. Check the data set for outliers.
Verified step by step guidance
1
Step 1: Organize the data in ascending order. Since the data is currently unordered, sort all 40 wait times from smallest to largest to facilitate finding quartiles and identifying outliers.
Step 2: Determine the quartiles. Since there are 40 data points, calculate the positions of Q1 (the first quartile), Q2 (the median), and Q3 (the third quartile) using the formulas:
\(Q1 = \text{value at position } \frac{n+1}{4}\)
\(Q2 = \text{value at position } \frac{n+1}{2}\)
\(Q3 = \text{value at position } 3 \times \frac{n+1}{4}\)
where \(n=40\). Find the values at these positions in the sorted data.
Step 3: Interpret the quartiles. Explain that Q1 represents the 25th percentile (25% of wait times are below this value), Q2 is the median (50% below), and Q3 is the 75th percentile (75% below). This gives a sense of the distribution of wait times.
Step 4: Calculate the interquartile range (IQR) using the formula:
\(IQR = Q3 - Q1\)
This measures the spread of the middle 50% of the data.
Step 5: Check for outliers using the IQR. Calculate the lower bound as \(Q1 - 1.5 \times IQR\) and the upper bound as \(Q3 + 1.5 \times IQR\). Any data points below the lower bound or above the upper bound are considered outliers.
Verified video answer for a similar problem:
This video solution was recommended by our tutors as helpful for the problem above
Video duration:
4m
Play a video:
0 Comments
Key Concepts
Here are the essential concepts you must grasp in order to answer the question correctly.
Quartiles
Quartiles divide a data set into four equal parts after the data is sorted. The first quartile (Q1) is the median of the lower half, the second quartile (Q2) is the overall median, and the third quartile (Q3) is the median of the upper half. Quartiles help summarize the distribution and spread of the data.
Outliers are data points that differ significantly from other observations. They can be identified using the interquartile range (IQR), where values below Q1 - 1.5*IQR or above Q3 + 1.5*IQR are considered outliers. Detecting outliers is important as they can affect statistical analysis.
Organizing and sorting data is essential before calculating quartiles or identifying outliers. Sorting arranges data in ascending order, making it easier to find medians and quartiles accurately. Proper data handling ensures correct interpretation and analysis.

 Verified step by step guidance
 07:11
07:11