Ch. 3 - Describing, Exploring, and Comparing Data
Triola - Elementary Statistics 14th Edition
Triola14th EditionElementary StatisticsISBN: 9780137366446Not the one you use?Change textbook
Chapter 3, Problem 3.CQQ.5

Roller Coaster Speed Outlier Identify any outliers among the data listed for Exercise 1.

Verified step by step guidance
1
Step 1: Understand the concept of outliers. Outliers are data points that are significantly different from the rest of the dataset. They can be identified using statistical methods such as the Interquartile Range (IQR) or Z-scores.
Step 2: Organize the data in ascending order. This helps in calculating measures like the median and quartiles, which are essential for identifying outliers using the IQR method.
Step 3: Calculate the first quartile (Q1) and third quartile (Q3). Q1 is the median of the lower half of the data, and Q3 is the median of the upper half of the data.
Step 4: Compute the Interquartile Range (IQR) using the formula: IQR=Q3-Q1. Then, determine the lower and upper bounds for outliers using the formulas: Lower:Q1-1.5×IQR and Upper:Q3+1.5×IQR.
Step 5: Compare each data point to the lower and upper bounds. Any data point that falls below the lower bound or above the upper bound is considered an outlier.

Verified video answer for a similar problem:

This video solution was recommended by our tutors as helpful for the problem above.
Video duration:
4m
Was this helpful?

Key Concepts

Here are the essential concepts you must grasp in order to answer the question correctly.

Outliers

Outliers are data points that differ significantly from other observations in a dataset. They can indicate variability in measurement, experimental errors, or novel phenomena. Identifying outliers is crucial as they can skew statistical analyses and affect the results of tests, leading to potentially misleading conclusions.
Recommended video:
Guided course
04:48
Comparing Mean vs. Median

Statistical Measures

Statistical measures such as mean, median, and standard deviation are essential for understanding the distribution of data. The mean provides the average value, while the median offers the middle point, and the standard deviation indicates the spread of data around the mean. These measures help in determining whether a data point is an outlier by comparing it to the overall dataset.
Recommended video:
Guided course
05:53
Parameters vs. Statistics

Box Plot

A box plot is a graphical representation that summarizes the distribution of a dataset through its quartiles. It highlights the median, upper and lower quartiles, and potential outliers. By visualizing the data in this way, one can easily identify outliers that fall outside the whiskers of the box plot, facilitating a clearer understanding of data variability.
Recommended video:
04:01
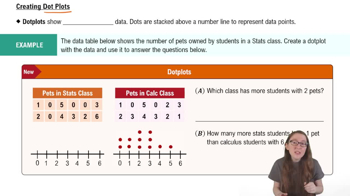
Creating Dotplots
Related Practice
Textbook Question

Mean of Roller Coaster Speeds Listed below are maximum speeds (km/h) of randomly selected roller coasters in the United States. Find the mean.

7076978157151194651176545105

168
views

Textbook Question

Sugar Listed below are measured weights (mg) of sugar in Domino packets labelled as containing 3500 mg (or 3.5 g).


[IMAGE]


d. Given that the weights are from Domino sugar packets selected from a much larger population, are the weights a sample or a population?

221
views
Textbook Question

In Exercises 5–20, find the range, variance, and standard deviation for the given sample data. Include appropriate units (such as “minutes”) in your results. (The same data were used in Section 3-1, where we found measures of center. Here we find measures of variation.) Then answer the given questions.


Smart Thermostats Listed below are selling prices (dollars) of smart thermostats tested by Consumer Reports magazine. Are any of the resulting statistics helpful in selecting a smart thermostat for purchase?


250 170 225 100 250 250 130 200 150 250 170 200 180 250

163
views
Textbook Question

The Empirical Rule Based on Data Set 1 “Body Data” in Appendix B, blood platelet counts of women have a bell-shaped distribution with a mean of 255.1 and a standard deviation of 65.4. (All units are 1000 cells/) Using the empirical rule, what is the approximate percentage of women with platelet counts


a. within 2 standard deviations of the mean, or between 124.3 and 385.9?

227
views
Textbook Question

Normal Distribution Examine the distribution shown in the histogram from Exercise 6. Does it appear that the sample data are from a population with a normal distribution? Why or why not?

173
views
Textbook Question

Correlation Between Magnitudes and Depths Using the paired magnitude/depth data, construct the graph that is helpful in determining whether there is a correlation between earthquake magnitudes and depths. Based on the result, does there appear to be a correlation?

167
views