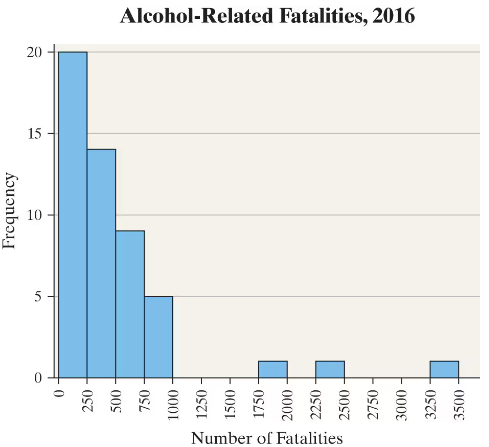
Alcohol-Related Traffic Fatalities The frequency histogram represents the number of alcohol-related traffic fatalities by state (including Washington, D.C.) in 2016 according to the National Highway Traffic Safety Administration. a. Determine the class width. b. Identify the classes.
Verified step by step guidance
1
Step 1: To determine the class width, observe the range of the number of fatalities covered by each bar (class) in the histogram. The class width is the difference between the upper and lower boundaries of any class interval.
Step 2: Identify the lower and upper boundaries of one class. For example, the first class starts at 0 fatalities and ends just before 250 fatalities. The next class starts at 250 and ends just before 500 fatalities.
Step 3: Calculate the class width by subtracting the lower boundary of a class from the lower boundary of the next class. For example, class width = 250 - 0 = 250 fatalities.
Step 4: To identify the classes, list all the intervals represented by the bars in the histogram. Based on the histogram, the classes are intervals such as 0 to less than 250, 250 to less than 500, 500 to less than 750, and so on.
Step 5: Write down all the classes clearly, ensuring each class covers a range of 250 fatalities, continuing up to the maximum number shown on the histogram (e.g., 0-249, 250-499, 500-749, etc.).
Verified video answer for a similar problem:
This video solution was recommended by our tutors as helpful for the problem above
Video duration:
2m
Play a video:
0 Comments
Key Concepts
Here are the essential concepts you must grasp in order to answer the question correctly.
Class Width
Class width is the difference between the upper and lower boundaries of any class in a frequency distribution. It determines the size of each interval or bin in a histogram and is calculated by subtracting the lower class limit of one class from the lower class limit of the next class. Consistent class widths help in accurately representing data distribution.
Classes are the intervals into which data values are grouped in a frequency distribution or histogram. Each class covers a range of values, and the classes should be mutually exclusive and exhaustive to include all data points without overlap. Identifying classes helps organize data for easier analysis and visualization.
A frequency histogram visually displays the distribution of data by showing the frequency of data points within each class interval. The height of each bar represents the number of observations in that class. Understanding how to read a histogram is essential for identifying patterns, such as skewness or concentration of data.

 Verified step by step guidance
 05:18
05:18