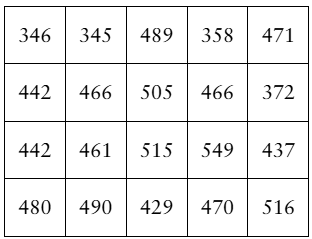
In Problems 3 and 4, (a) identify the shape of the distribution and (b) determine the five-number summary. Assume that each number in the five-number summary is an integer.
Table of contents
- 1. Intro to Stats and Collecting Data1h 14m
- 2. Describing Data with Tables and Graphs1h 55m
- 3. Describing Data Numerically2h 5m
- 4. Probability2h 16m
- 5. Binomial Distribution & Discrete Random Variables3h 6m
- 6. Normal Distribution and Continuous Random Variables2h 11m
- 7. Sampling Distributions & Confidence Intervals: Mean3h 23m
- Sampling Distribution of the Sample Mean and Central Limit Theorem19m
- Distribution of Sample Mean - Excel23m
- Introduction to Confidence Intervals15m
- Confidence Intervals for Population Mean1h 18m
- Determining the Minimum Sample Size Required12m
- Finding Probabilities and T Critical Values - Excel28m
- Confidence Intervals for Population Means - Excel25m
- 8. Sampling Distributions & Confidence Intervals: Proportion1h 25m
- 9. Hypothesis Testing for One Sample3h 29m
- 10. Hypothesis Testing for Two Samples4h 50m
- Two Proportions1h 13m
- Two Proportions Hypothesis Test - Excel28m
- Two Means - Unknown, Unequal Variance1h 3m
- Two Means - Unknown Variances Hypothesis Test - Excel12m
- Two Means - Unknown, Equal Variance15m
- Two Means - Unknown, Equal Variances Hypothesis Test - Excel9m
- Two Means - Known Variance12m
- Two Means - Sigma Known Hypothesis Test - Excel21m
- Two Means - Matched Pairs (Dependent Samples)42m
- Matched Pairs Hypothesis Test - Excel12m
- 11. Correlation1h 24m
- 12. Regression1h 50m
- 13. Chi-Square Tests & Goodness of Fit2h 21m
- 14. ANOVA1h 57m
3. Describing Data Numerically
Percentiles & Quartiles
Problem 3.4.25
Textbook Question
[DATA] Fraud Detection As part of its “Customers First” program, a cellular phone company monitors monthly phone usage. The program identifies unusual use and alerts the customer that their phone may have been used by another person. The data below represent the monthly phone use in minutes of a customer enrolled in this program for the past 20 months. The phone company decides to use the upper fence as the cutoff point for the number of minutes at which the customer should be contacted. What is the cutoff point?

Verified step by step guidance1
Step 1: Organize the data in ascending order to make it easier to find the quartiles. The data points are: 346, 345, 489, 358, 471, 442, 466, 505, 466, 372, 442, 461, 515, 549, 437, 480, 490, 429, 470, 516.
Step 2: Find the first quartile (Q1) and the third quartile (Q3). Q1 is the median of the lower half of the data, and Q3 is the median of the upper half of the data.
Step 3: Calculate the interquartile range (IQR) using the formula: \(\text{IQR} = Q3 - Q1\).
Step 4: Calculate the upper fence using the formula: \(\text{Upper Fence} = Q3 + 1.5 \times \text{IQR}\).
Step 5: The cutoff point for contacting the customer is the value of the upper fence. Any monthly phone usage above this value is considered unusual and triggers an alert.
Verified video answer for a similar problem:This video solution was recommended by our tutors as helpful for the problem above
Video duration:
4mPlay a video:
Was this helpful?
Key Concepts
Here are the essential concepts you must grasp in order to answer the question correctly.
Interquartile Range (IQR)
The Interquartile Range (IQR) measures the spread of the middle 50% of a data set. It is calculated as the difference between the third quartile (Q3) and the first quartile (Q1). IQR helps identify the range within which the central data values lie, reducing the influence of outliers.
Recommended video:
Empirical Rule of Standard Deviation and Range Rule of Thumb
Quartiles (Q1 and Q3)
Quartiles divide a data set into four equal parts. The first quartile (Q1) is the median of the lower half, and the third quartile (Q3) is the median of the upper half. These values help summarize data distribution and are essential for calculating the IQR and fences.
Recommended video:
Percentiles and Quartiles
Upper Fence for Outlier Detection
The upper fence is a boundary used to detect unusually high values (outliers) in data. It is calculated as Q3 plus 1.5 times the IQR (Upper Fence = Q3 + 1.5 × IQR). Values above this cutoff are considered outliers and, in this context, trigger alerts for unusual phone usage.
Recommended video:
Guided course
Comparing Mean vs. Median
Watch next
Master Percentiles and Quartiles with a bite sized video explanation from Patrick
Start learningRelated Videos
Related Practice
Textbook Question
18
views
