Ch. 3 - Probability
Larson - Elementary Statistics: Picturing the World 8th Edition
Larson8th EditionElementary Statistics: Picturing the WorldISBN: 9780137493470Not the one you use?Change textbook
Chapter 3, Problem 3.1.52

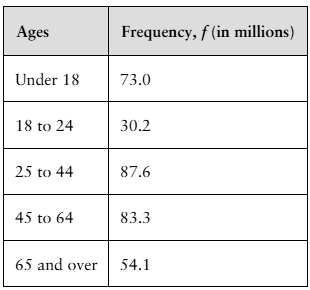
Using a Frequency Distribution to Find Probabilities In Exercises 49-52, use the frequency distribution at the left, which shows the population of the United States by age group, to find the probability that a U.S. resident chosen at random is in the age range. (Source: U.S. Census Bureau)
52. 65 years old and older
tab1

Verified step by step guidance
1
Step 1: Understand the problem. We are tasked with finding the probability that a randomly chosen U.S. resident is 65 years old or older. To do this, we need to use the frequency distribution table provided.
Step 2: Identify the relevant data. From the table, the frequency for the age group '65 and over' is 54.1 million. The total population is the sum of all frequencies in the table.
Step 3: Calculate the total population. Add the frequencies for all age groups: 73.0 + 30.2 + 87.6 + 83.3 + 54.1. This gives the total population in millions.
Step 4: Use the formula for probability. The probability of a U.S. resident being 65 years old or older is given by the formula: P(65 and over) = (Frequency of 65 and over) / (Total population).
Step 5: Simplify the fraction. Divide the frequency for '65 and over' (54.1 million) by the total population calculated in Step 3 to find the probability. Express the result as a decimal or percentage.

Verified video answer for a similar problem:

This video solution was recommended by our tutors as helpful for the problem above.
Video duration:
2m
Was this helpful?

Key Concepts

Here are the essential concepts you must grasp in order to answer the question correctly.

Frequency Distribution

A frequency distribution is a summary of how often each value occurs in a dataset. It organizes data into categories (or bins) and shows the number of observations (frequency) for each category. In this case, the frequency distribution presents the population of the U.S. by age group, allowing for easy visualization of how many people fall into each age category.
Recommended video:
Guided course
06:38
Intro to Frequency Distributions

Probability

Probability is a measure of the likelihood that a particular event will occur, expressed as a number between 0 and 1. In the context of the question, it involves calculating the probability that a randomly selected U.S. resident belongs to a specific age group, which can be determined by dividing the frequency of that age group by the total population.
Recommended video:
5:37
Introduction to Probability

Total Population

The total population refers to the sum of all individuals in the dataset being analyzed. To find the probability of a resident being in a specific age group, one must first calculate the total population by summing the frequencies of all age groups. This total serves as the denominator in the probability calculation, providing a context for the relative size of each age group.
Recommended video:
04:48
Population Standard Deviation Known
Related Practice
Textbook Question

Using the Multiplication Rule In Exercises 19-32, use the Multiplication Rule.

20. Coin and Die A coin is tossed and a die is rolled. Find the probability of tossing a tail and then rolling a number greater than 2.

145
views

Textbook Question

Classifying Events as Independent or Dependent In Exercises 9-14, determine whether the events are independent or dependent. Explain your reasoning.

14. A ball is selected from a bin of balls numbered from 1 through 52. It is replaced, and then a second numbered ball is selected from the bin.

85
views
Textbook Question

Board of Directors The University of Colorado Board of Directors has 23 members. One member serves as board chair and another serves as vice chair. Given the names of the 23

board members, what is the probability of randomly selecting the name of the chair and the name of the vice chair? (Source: University of Colorado)

79
views
Textbook Question

37. Water Pollution An environmental agency is analyzing water samples from 80 lakes for pollution. Five of the lakes have dangerously high levels of dioxin. Six lakes are randomly selected from the sample. Use technology to find how many ways one polluted lake and five nonpolluted lakes can be chosen.

125
views
Textbook Question

Matching Probabilities In Exercises 11-16, match the event with its probability.

a. 0.95

b. 0.005

c. 0.25

d. 0

e. 0.375

f. 0.5

16. You toss a coin four times. What is the probability of tossing tails exactly half of the time?

135
views
Textbook Question

Warehouse In Exercises 51-54, a warehouse employs 24 workers on first shift, 17 workers on second shift, and 13 workers on third shift. Eight workers are chosen at random to be

interviewed about the work environment.

Find the probability of choosing four third-shift workers.

125
views