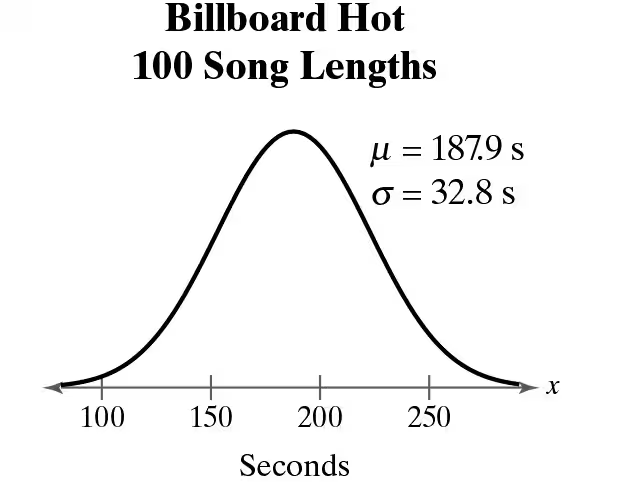
Finding Specified Data Values In Exercises 31–38, answer the questions about the specified normal distribution.
Billboard Hot 100 The length (in seconds) of the 100 most popular songs during the week of May 5, 2021, can be approximated by a normal distribution, as shown in the figure. (Source: Spotify)
b. What song length represents the 17th percentile?
Verified step by step guidance
1
Step 1: Identify the key parameters of the normal distribution from the problem. The mean (μ) is 187.9 seconds, and the standard deviation (σ) is 32.8 seconds.
Step 2: Understand the concept of the 17th percentile. The 17th percentile represents the value below which 17% of the data falls. This corresponds to a cumulative probability of 0.17 in the standard normal distribution.
Step 3: Convert the cumulative probability (0.17) to a z-score using a standard normal table or statistical software. The z-score is a standardized value that represents the number of standard deviations a data point is from the mean.
Step 4: Use the z-score formula to find the song length (x) corresponding to the 17th percentile: . Substitute the values of μ, σ, and the z-score obtained in Step 3.
Step 5: Solve the equation to find the song length (x) that represents the 17th percentile. This will give the desired value in seconds.
Verified video answer for a similar problem:
This video solution was recommended by our tutors as helpful for the problem above
Video duration:
2m
Play a video:
0 Comments
Key Concepts
Here are the essential concepts you must grasp in order to answer the question correctly.
Normal Distribution
A normal distribution is a continuous probability distribution characterized by its bell-shaped curve, defined by its mean (µ) and standard deviation (σ). In this context, the song lengths are normally distributed around a mean of 187.9 seconds, with a standard deviation of 32.8 seconds, indicating how song lengths vary around the average.
Using the Normal Distribution to Approximate Binomial Probabilities
Percentiles
A percentile is a measure used in statistics to indicate the value below which a given percentage of observations fall. For example, the 17th percentile represents the length below which 17% of the song lengths are found. This concept is crucial for determining specific data values within a distribution.
A Z-score is a statistical measurement that describes a value's relationship to the mean of a group of values, expressed in terms of standard deviations. To find the 17th percentile in a normal distribution, one can use Z-scores to identify the corresponding value that represents this percentile, allowing for the calculation of specific song lengths.