Join thousands of students who trust us to help them ace their exams!
Multiple Choice
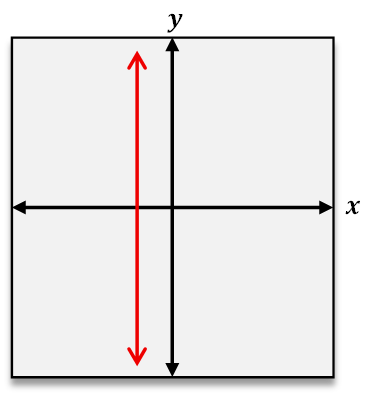
Which of the following is the graph of a one-to-one function?
A
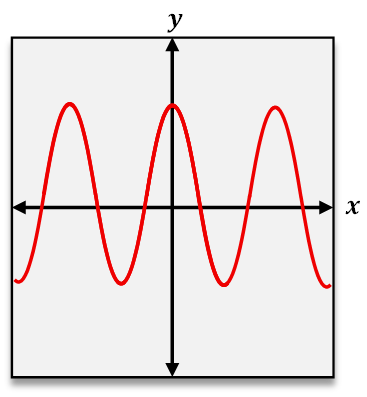
B
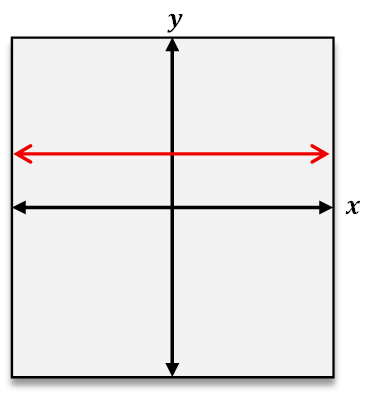
C
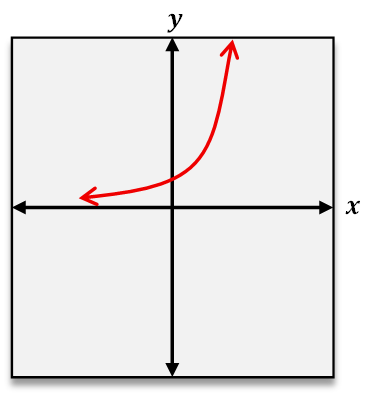
D
0 Comments
Verified step by step guidance
1
Step 1: Understand the definition of a one-to-one function. A function is one-to-one if each output (y-value) corresponds to exactly one input (x-value). This means no horizontal line should intersect the graph more than once.
Step 2: Apply the Horizontal Line Test to each graph. Draw or imagine horizontal lines across the graph and check how many times each line intersects the graph.
Step 3: Analyze the first graph (vertical red line). It fails the function test because it is a vertical line, not a function, as it does not pass the vertical line test.
Step 4: Analyze the second graph (oscillating curve). It fails the one-to-one test because horizontal lines intersect the graph multiple times, indicating multiple x-values for the same y-value.
Step 5: Analyze the third graph (horizontal red line). It fails the one-to-one test because a horizontal line intersects it infinitely many times, meaning multiple x-values correspond to the same y-value.
Step 6: Analyze the fourth graph (increasing curve). It passes the one-to-one test because any horizontal line will intersect the graph at most once, indicating each y-value corresponds to exactly one x-value.


 Verified step by step guidance