Join thousands of students who trust us to help them ace their exams!
Multiple Choice
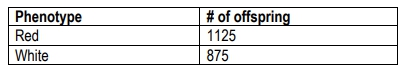
A cross of white plants and red plants was performed. Using the F2 phenotypic ratio data below, determine what form of gene interaction is taking place.
A
Dominant Epistasis
B
Recessive Epistasis
C
Suppressors
D
Complementary Gene Action
0 Comments
Verified step by step guidance
1
Examine the phenotypic ratio of the F2 generation. The data shows 1125 red offspring and 875 white offspring.
Calculate the total number of offspring by adding the number of red and white offspring: 1125 + 875.
Determine the phenotypic ratio by dividing the number of each phenotype by the total number of offspring. This will help identify the pattern of inheritance.
Consider the possible gene interactions listed: Dominant Epistasis, Recessive Epistasis, Suppressors, and Complementary Gene Action. Complementary Gene Action often results in a 9:7 ratio, which is close to the observed ratio.
Conclude that the observed phenotypic ratio suggests Complementary Gene Action, where two genes interact to produce a phenotype, and both must be present for the red color to appear.


 Verified step by step guidance
