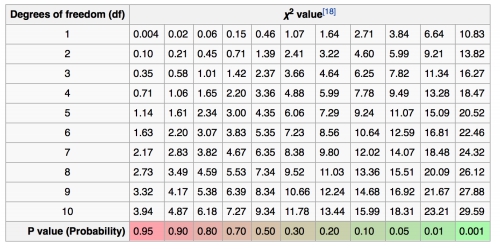
If you haven't seen the other Chi Square analysis video, I suggest you watch that first. Because that video is going to explain how to walk through the formula and everything, like why you do certain things. Whereas, this video is actually just going to assume that you have been through that video and know what I'm talking about, and just use the formula for a linkage problem. So remember that a Chi Square test can be used to identify the likelihood of something that you're tested. Tested. So in this case, we're looking at gene linkage. So it's going to be the likelihood that 2 genes are linked. And so, because the Chi Square test evaluates whether your experimental values are different from the predicted values, it uses this formula here: Χ² = Σ((O - E)² / E), where Ι is your Chi Square, and this is Sum, then you have Observed and Expected. Now, again, if you don't understand this formula, go back and watch the other Chi Square video first, because you really have to understand this before we can move on. So with this example, it says that I want to know if genes a and genes b are linked. So I have this, you know, I know about 2 genes, and I want to see if they're linked or not. And so, I do an experiment, and I cross 2 heterozygous organisms. And this is super important. You have to do heterozygous organisms for these crosses. But I'm giving that to you in the problem, so it doesn't really matter. Just make sure if you see a problem like this, you make sure it's heterozygous. So they get 50 offspring. There's 31 parental and 19 recombinant. So there are 31 that look like the parents, That's supposed to be a highlight. And 19 that look like a mixture of the parents. So, is it likely that a and b are linked? Okay. So the first thing you do when you're answering a Chi square question is you figure out what the expected numbers are. So I did this cross, so if a and b are linked, what would my expected numbers be? And if they're not linked, which is the question we're actually going to ask, The two genes are not linked, what are the expected numbers going to be? So, two not linked genes have a recombination frequency of what? Do you remember? So if the genes are not linked, their recombination frequency is going to be around 50 or lower. Right. It's going to be around 50%. So that means that if I have 50 offspring and the genes are not linked, then I would expect to get 50% parental and 50% recombinant of the mixture. Because the recombination frequency is 50%. And so 50% of 50 is going to be 25. So there would be 25 parental and 25 recombinants. Now, these are my expected numbers. So if everything's working perfectly, these two genes are not linked, I would get 25 parental and 25 recombinants. Now the second thing is to actually calculate the Chi Square. And that's going to look at the difference between what I experimentally got, which was 31 and 19, compared to what I predicted to get, via the recombination frequency, which was 25 and 25. So here's a chart. I typically like to use these charts. Here's the parental, so those look like the parents and the recombinant of the mixtures. This is what I observed was 31 and 19. This is what I expected, 25 and 25. And so if I put this into the Chi Square formula, which is this, right? If you go back up, oh, sorry. If you go back up, this formula right here, then I get 1.44, and that gets me a 2.88 calculation. Now, you feel free to go back and do this math if you'd like, but these should be your chi squared value. So what do you do with that chi what does 2.88 mean? Well, really nothing, but it's just a value that you have to find on a chart. So we start looking at the chart to determine what the p value is, which is always the third step. So how do you use this chart? The first thing you always do is figure out what your degrees of freedom are. This case, our degrees of freedom are 1. We know this because we have two traits. We have the parental and the recombinant that we're looking at. Right? So that is the number of variables minus 1 equals degrees of freedom, which in this case is 1. 2 minus 1 equals 1. The easiest math you're gonna do in genetics. So we have our degrees of freedom, so we now know we're gonna use this row. Right? Degrees of freedom here. There's 1, so that's the row we're going to use. Then we have to find our Chi square value on this row. And so it's between, I don't know why this box got moved over here, but actually it's between, let me actually use a brighter color. So here. This is our, this is our real box here. It's between 2.77 and 3.84. How do I know that? Because 2.71 is less than 2.88 and 2.88 is less than 3.84. And that's our Chi Squared value. So here's our chart and we know it's between here, So we find our p value. Remember, that was the purpose of step 3. And so our p value is between point 10 and point 0 5. So if we turn that, times it by a 100, or multiply it by a 100, and that gets you the percentage of your p value. So, 10% to 5%. So now we have 10% to 5%. What does that mean? Well, we use those numbers to figure out whether we accept or reject the null hypothesis. So take a second, what do you think the null hypothesis was in this question? You have an idea? So the null hypothesis always says that the values are not different, so that the expected and the observed values are not different. So if we reflect this back to the question that we were asking, we were asking that linkage. So if the expected and the observed are not different, that means the genes would not be linked. So how do we determine that? Well, we take that 10% to 5% that we just found with the p value. And we say that if the p values are greater than 5, we accept the null hypothesis, which they were. Right? Our lowest was 5%, and our highest was 10%. So these are greater than 5%, so we accept the null hypothesis, which stated that these values are not different and therefore, they're not linked. So we can say with 95% confidence, if you don't know how I got that number, remember this has to do with the 5% value that we chose here for the p value, but I can say with 95% confidence that the genes are not linked. Now, the important thing to remember here is I haven't proved or confirmed linkage at all. Right? I haven't actually looked at the genes and sequenced it, and I don't know a 100%. Only can say with 95% confidence that the genes are not linked. So it states a likelihood, not an exact measure. Right? I would have to do more tests to confirm that they're not linked, but I'm pretty confident. 95% is pretty good. I'm pretty confident that the genes are not linked. So that is the Chi Square Test for linkage. Let's now move on.
4. Genetic Mapping and Linkage
Chi Square and Linkage
4. Genetic Mapping and Linkage
Chi Square and Linkage - Online Tutor, Practice Problems & Exam Prep
1
concept
Chi Square and Linkage
Video duration:
7mPlay a video:
Video transcript
2
Problem
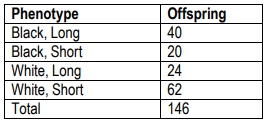
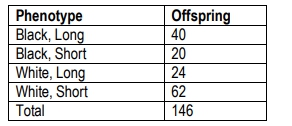
ProblemBlack(B) rabbit coat colors are dominant to white(b) coat colors. Long hair (H) is dominant to short hair (h). A breeder crosses a rabbit homozygous for white, short hair with a homozygous black rabbit with long hair. The F1 is backcrossed to the rabbit with white, short hair and the following progeny are produced. Use the chi-square test to answer the following questions.
What are the expected offspring numbers if the two genes are not linked, and therefore assort independently?
A
73 parental, 73 recombinant
B
146 parental, 0 recombinant
C
60 parental, 86 recombinant
D
102 parental, 44 recombinant
3
Problem
ProblemCalculate the chi-square value for the above problem.
A
23.00
B
5.89
C
0.02
D
0.467
4
Problem
ProblemIn this example, how many degrees of freedom should be used?
A
1
B
2
C
3
D
4
5
Problem
ProblemUsing the appropriate chi-square value and degrees of freedom, do the coat color and hair length genes assort independently?
A
Yes, both genes assort independently
B
No, both genes do not assort independently (meaning they are linked)
Do you want more practice?
More setsYour Genetics tutor
Additional resources for Chi Square and Linkage
PRACTICE PROBLEMS AND ACTIVITIES (12)
- Define linkage disequilibrium. What is the physical basis of linkage, and what causes linkage equilibrium? Exp...
- Researchers cross a corn plant that is pure-breeding for the dominant traits colored aleurone (C1), full kerne...
- Three dominant traits of corn seedlings, tunicate seed (T-), glossy appearance (G-), and liguled stem (L-), ar...
- T. H. Morgan's data on eye color and wing form, shown in Figures 5.3 and 5.5, reveal genetic linkage between t...
- A Drosophila experiment examining potential genetic linkage of X-linked genes studies a recessive eye mutant (...