Join thousands of students who trust us to help them ace their exams!
Multiple Choice
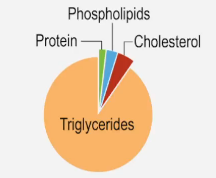
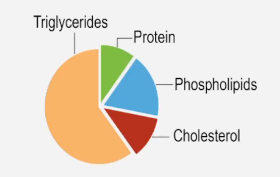
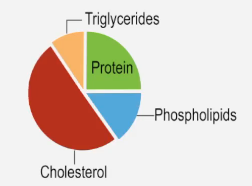
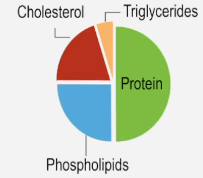
Which of the following pie charts correspond best with HDL?
A
B
C
D
0 Comments
Verified step by step guidance
1
Step 1: Understand the composition of HDL (High-Density Lipoprotein). HDL is known for its high protein content relative to other lipoproteins, with lower amounts of triglycerides and cholesterol.
Step 2: Analyze the pie charts provided. Look for the chart where the protein section is the largest proportion compared to triglycerides, cholesterol, and phospholipids.
Step 3: Compare the proportions of each component in the pie charts. HDL should have a dominant protein section, followed by smaller proportions of phospholipids, cholesterol, and minimal triglycerides.
Step 4: Identify the pie chart that matches the expected composition of HDL. The chart with the largest green section (protein) and minimal orange section (triglycerides) is most likely to represent HDL.
Step 5: Confirm your choice by ensuring the proportions align with the known characteristics of HDL, which is primarily protein-rich and has low triglyceride content.


 Verified step by step guidance
