What is the difference between a discrete random variable and a continuous random variable? Provide your own examples of each.
Table of contents
- 1. Intro to Stats and Collecting Data1h 14m
- 2. Describing Data with Tables and Graphs1h 55m
- 3. Describing Data Numerically2h 5m
- 4. Probability2h 16m
- 5. Binomial Distribution & Discrete Random Variables3h 6m
- 6. Normal Distribution and Continuous Random Variables2h 11m
- 7. Sampling Distributions & Confidence Intervals: Mean3h 23m
- Sampling Distribution of the Sample Mean and Central Limit Theorem19m
- Distribution of Sample Mean - Excel23m
- Introduction to Confidence Intervals15m
- Confidence Intervals for Population Mean1h 18m
- Determining the Minimum Sample Size Required12m
- Finding Probabilities and T Critical Values - Excel28m
- Confidence Intervals for Population Means - Excel25m
- 8. Sampling Distributions & Confidence Intervals: Proportion1h 25m
- 9. Hypothesis Testing for One Sample3h 29m
- 10. Hypothesis Testing for Two Samples4h 50m
- Two Proportions1h 13m
- Two Proportions Hypothesis Test - Excel28m
- Two Means - Unknown, Unequal Variance1h 3m
- Two Means - Unknown Variances Hypothesis Test - Excel12m
- Two Means - Unknown, Equal Variance15m
- Two Means - Unknown, Equal Variances Hypothesis Test - Excel9m
- Two Means - Known Variance12m
- Two Means - Sigma Known Hypothesis Test - Excel21m
- Two Means - Matched Pairs (Dependent Samples)42m
- Matched Pairs Hypothesis Test - Excel12m
- 11. Correlation1h 24m
- 12. Regression1h 50m
- 13. Chi-Square Tests & Goodness of Fit2h 21m
- 14. ANOVA1h 57m
5. Binomial Distribution & Discrete Random Variables
Discrete Random Variables
Problem 6.1.15
Textbook Question
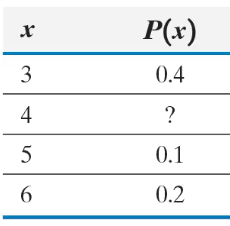
In Problems 15 and 16, determine the required value of the missing probability to make the distribution a discrete probability distribution.

Verified step by step guidance
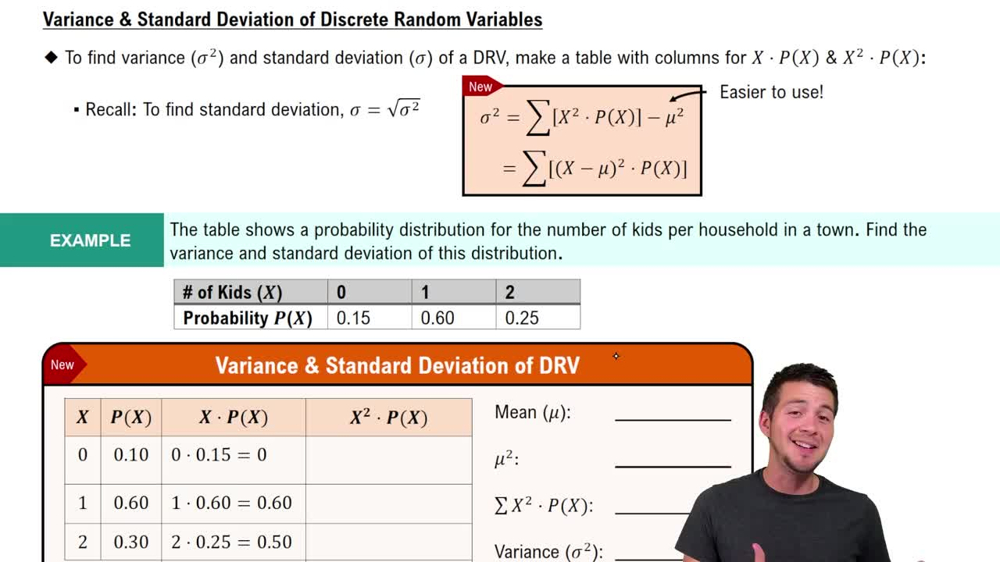
1
Step 1: Understand that for a discrete probability distribution, the sum of all probabilities must equal 1. This is a fundamental property of probability distributions.
Step 2: Identify the known probabilities from the table: \(P(3) = 0.4\), \(P(5) = 0.1\), and \(P(6) = 0.2\). The missing probability is \(P(4)\), which we need to find.
Step 3: Set up the equation representing the sum of all probabilities: \(P(3) + P(4) + P(5) + P(6) = 1\).
Step 4: Substitute the known values into the equation: \$0.4 + P(4) + 0.1 + 0.2 = 1$.
Step 5: Solve for \(P(4)\) by combining the known probabilities and subtracting from 1: \(P(4) = 1 - (0.4 + 0.1 + 0.2)\).
Verified video answer for a similar problem:This video solution was recommended by our tutors as helpful for the problem above
Video duration:
1mPlay a video:
Was this helpful?
Key Concepts
Here are the essential concepts you must grasp in order to answer the question correctly.
Discrete Probability Distribution
A discrete probability distribution assigns probabilities to each possible value of a discrete random variable. Each probability must be between 0 and 1, and the sum of all probabilities must equal 1 to represent a valid distribution.
Recommended video:
Guided course
Variance & Standard Deviation of Discrete Random Variables
Sum of Probabilities Equals One
In any probability distribution, the total of all individual probabilities must be exactly 1. This ensures that the distribution accounts for all possible outcomes of the random variable.
Recommended video:
Introduction to Probability
Finding Missing Probability
To find a missing probability in a distribution, subtract the sum of the known probabilities from 1. The result is the value needed to complete the distribution so that the total probability sums to 1.
Recommended video:
Introduction to Probability
Watch next
Master Intro to Random Variables & Probability Distributions with a bite sized video explanation from Patrick
Start learningRelated Videos
Related Practice
Textbook Question
5
views
