Take this test as you would take a test in class.For each exercise, perform the steps below. c.Find the critical value(s) and identify the rejection region(s).
A real estate agency says that the mean home sales price in Olathe, Kansas, is greater than in Rolla, Missouri. The mean home sales price for 39 homes in Olathe is \$392,453. Assume the population standard deviation is \$224,902. The mean home sales price for 38 homes in Rolla is \$285,787. Assume the population standard deviation is \$330,578. At α=0.05, is there enough evidence to support the agency’s claim? (Adapted from Realtor.com)
Verified step by step guidance
1
Identify the type of test and the hypotheses. Since the agency claims that the mean home sales price in Olathe is greater than in Rolla, this is a right-tailed test. The null hypothesis is \(H_0: \mu_{Olathe} \leq \mu_{Rolla}\) and the alternative hypothesis is \(H_a: \mu_{Olathe} > \mu_{Rolla}\).
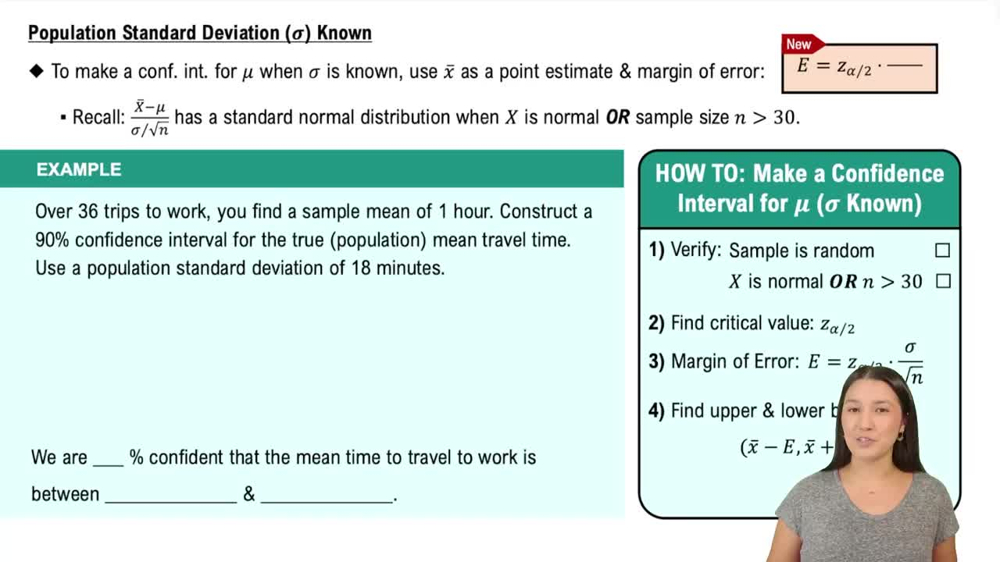
Determine the significance level \(\alpha = 0.05\) and the type of test statistic to use. Because the population standard deviations are known, use the Z-test for the difference between two means.
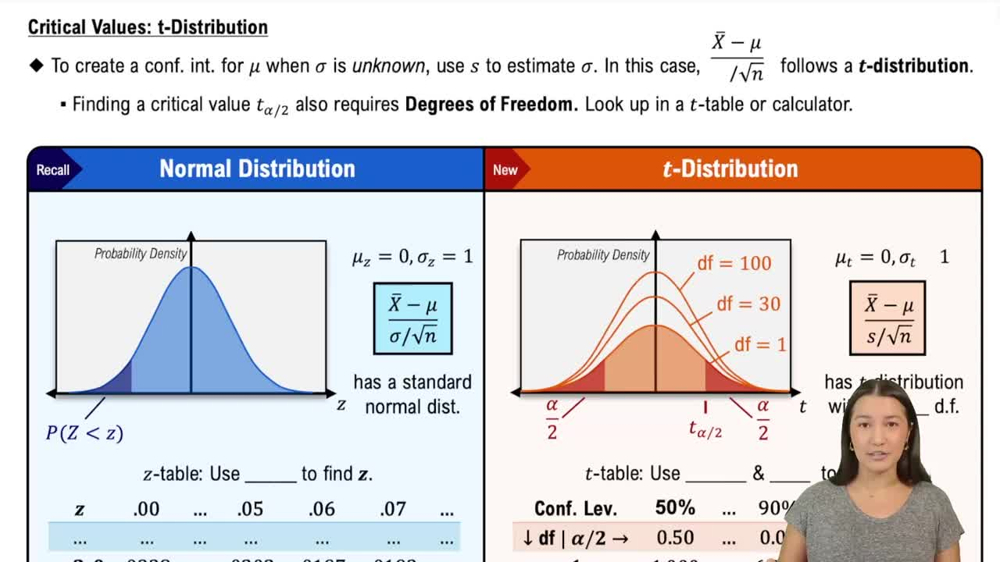
Find the critical value for a right-tailed Z-test at \(\alpha = 0.05\). This critical value corresponds to the Z-score where the area to the right is 0.05.
Define the rejection region based on the critical value. For a right-tailed test, the rejection region is all Z-scores greater than the critical value.
Summarize: If the calculated test statistic exceeds the critical value, reject the null hypothesis; otherwise, do not reject it.
Verified video answer for a similar problem:
This video solution was recommended by our tutors as helpful for the problem above
Video duration:
3m
Play a video:
0 Comments
Key Concepts
Here are the essential concepts you must grasp in order to answer the question correctly.
Hypothesis Testing
Hypothesis testing is a statistical method used to decide whether there is enough evidence to support a specific claim about a population parameter. It involves formulating a null hypothesis (no effect or difference) and an alternative hypothesis (the claim), then using sample data to determine if the null can be rejected at a given significance level.
The critical value is a threshold that defines the boundary of the rejection region in hypothesis testing. It depends on the significance level (α) and the test type (one-tailed or two-tailed). If the test statistic falls into the rejection region beyond the critical value, the null hypothesis is rejected.
Two-Sample Z-Test for Means with Known Population Standard Deviations
This test compares the means of two independent samples when population standard deviations are known. It calculates a Z statistic based on sample means, population standard deviations, and sample sizes to assess if the difference between means is statistically significant.

 Verified step by step guidance
 05:52
05:52