True or False: If the linear correlation coefficient is close to 0, then the two variables have no relation.
Table of contents
- 1. Intro to Stats and Collecting Data1h 14m
- 2. Describing Data with Tables and Graphs1h 56m
- 3. Describing Data Numerically2h 5m
- 4. Probability2h 17m
- 5. Binomial Distribution & Discrete Random Variables3h 6m
- 6. Normal Distribution and Continuous Random Variables2h 11m
- 7. Sampling Distributions & Confidence Intervals: Mean3h 23m
- Sampling Distribution of the Sample Mean and Central Limit Theorem19m
- Distribution of Sample Mean - ExcelBonus23m
- Introduction to Confidence Intervals15m
- Confidence Intervals for Population Mean1h 18m
- Determining the Minimum Sample Size Required12m
- Finding Probabilities and T Critical Values - ExcelBonus28m
- Confidence Intervals for Population Means - ExcelBonus25m
- 8. Sampling Distributions & Confidence Intervals: Proportion2h 10m
- 9. Hypothesis Testing for One Sample5h 8m
- Steps in Hypothesis Testing1h 6m
- Performing Hypothesis Tests: Means1h 4m
- Hypothesis Testing: Means - ExcelBonus42m
- Performing Hypothesis Tests: Proportions37m
- Hypothesis Testing: Proportions - ExcelBonus27m
- Performing Hypothesis Tests: Variance12m
- Critical Values and Rejection Regions28m
- Link Between Confidence Intervals and Hypothesis Testing12m
- Type I & Type II Errors16m
- 10. Hypothesis Testing for Two Samples5h 37m
- Two Proportions1h 13m
- Two Proportions Hypothesis Test - ExcelBonus28m
- Two Means - Unknown, Unequal Variance1h 3m
- Two Means - Unknown Variances Hypothesis Test - ExcelBonus12m
- Two Means - Unknown, Equal Variance15m
- Two Means - Unknown, Equal Variances Hypothesis Test - ExcelBonus9m
- Two Means - Known Variance12m
- Two Means - Sigma Known Hypothesis Test - ExcelBonus21m
- Two Means - Matched Pairs (Dependent Samples)42m
- Matched Pairs Hypothesis Test - ExcelBonus12m
- Two Variances and F Distribution29m
- Two Variances - Graphing CalculatorBonus16m
- 11. Correlation1h 24m
- 12. Regression3h 33m
- Linear Regression & Least Squares Method26m
- Residuals12m
- Coefficient of Determination12m
- Regression Line Equation and Coefficient of Determination - ExcelBonus8m
- Finding Residuals and Creating Residual Plots - ExcelBonus11m
- Inferences for Slope31m
- Enabling Data Analysis ToolpakBonus1m
- Regression Readout of the Data Analysis Toolpak - ExcelBonus21m
- Prediction Intervals13m
- Prediction Intervals - ExcelBonus19m
- Multiple Regression - ExcelBonus29m
- Quadratic Regression15m
- Quadratic Regression - ExcelBonus10m
- 13. Chi-Square Tests & Goodness of Fit2h 21m
- 14. ANOVA2h 29m
1. Intro to Stats and Collecting Data
Intro to Stats
Problem 4.1.18b
Textbook Question
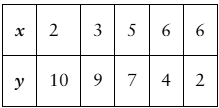
In Problems 17–20, (b) by hand, compute the correlation coefficient, and (c) determine whether there is a linear relation between x and y.

Verified step by step guidance1
Step 1: Organize the data points given as pairs \((x, y)\): \((2, 10), (3, 9), (5, 7), (6, 4), (6, 2)\).
Step 2: Calculate the means of \(x\) and \(y\) using the formulas:
\[\bar{x} = \frac{\sum x_i}{n}\]
\[\bar{y} = \frac{\sum y_i}{n}\]
where \(n\) is the number of data points.
Step 3: Compute the deviations from the mean for each \(x_i\) and \(y_i\), then calculate the products of these deviations, the squared deviations for \(x\), and the squared deviations for \(y\). Specifically, find:
\[\sum (x_i - \bar{x})(y_i - \bar{y}), \quad \sum (x_i - \bar{x})^2, \quad \sum (y_i - \bar{y})^2\]
Step 4: Use the formula for the Pearson correlation coefficient \(r\):
\[r = \frac{\sum (x_i - \bar{x})(y_i - \bar{y})}{\sqrt{\sum (x_i - \bar{x})^2 \sum (y_i - \bar{y})^2}}\]
This formula measures the strength and direction of the linear relationship between \(x\) and \(y\).
Step 5: Interpret the value of \(r\):
- If \(r\) is close to 1 or -1, there is a strong linear relationship.
- If \(r\) is close to 0, there is little to no linear relationship.
Use this to determine whether a linear relation exists between \(x\) and \(y\).
Verified video answer for a similar problem:This video solution was recommended by our tutors as helpful for the problem above
Video duration:
3mPlay a video:
0 Comments
Key Concepts
Here are the essential concepts you must grasp in order to answer the question correctly.
Correlation Coefficient
The correlation coefficient measures the strength and direction of a linear relationship between two variables, x and y. It ranges from -1 to 1, where values close to 1 or -1 indicate strong positive or negative linear relationships, respectively, and values near 0 suggest little or no linear correlation.
Recommended video:
Guided course
Correlation Coefficient
Calculation of Correlation Coefficient by Hand
To compute the correlation coefficient by hand, use the formula involving the covariance of x and y divided by the product of their standard deviations. This requires calculating means, deviations from the means, and sums of squares for both variables, then applying these values to the formula.
Recommended video:
Guided course
Calculating Correlation Coefficient - Graphing Calculator
Determining Linear Relationship
Determining if a linear relationship exists involves interpreting the correlation coefficient and examining the scatterplot of paired data. A strong correlation coefficient (close to ±1) and a pattern of points roughly forming a straight line indicate a linear relationship between x and y.
Recommended video:
Guided course
Coefficient of Determination
Related Videos
Related Practice
Textbook Question
68
views
