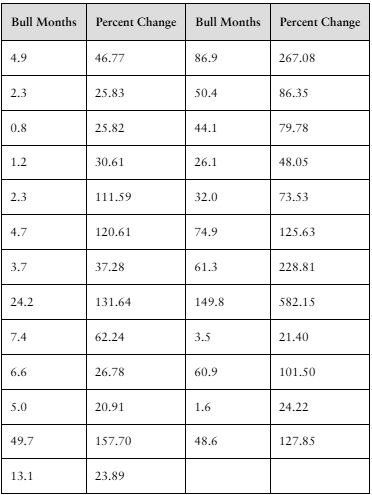
In Problems 17–20, (b) by hand, compute the correlation coefficient, and (c) determine whether there is a linear relation between x and y.
Table of contents
- 1. Intro to Stats and Collecting Data1h 14m
- 2. Describing Data with Tables and Graphs1h 55m
- 3. Describing Data Numerically2h 5m
- 4. Probability2h 16m
- 5. Binomial Distribution & Discrete Random Variables3h 6m
- 6. Normal Distribution and Continuous Random Variables2h 11m
- 7. Sampling Distributions & Confidence Intervals: Mean3h 23m
- Sampling Distribution of the Sample Mean and Central Limit Theorem19m
- Distribution of Sample Mean - Excel23m
- Introduction to Confidence Intervals15m
- Confidence Intervals for Population Mean1h 18m
- Determining the Minimum Sample Size Required12m
- Finding Probabilities and T Critical Values - Excel28m
- Confidence Intervals for Population Means - Excel25m
- 8. Sampling Distributions & Confidence Intervals: Proportion1h 25m
- 9. Hypothesis Testing for One Sample3h 29m
- 10. Hypothesis Testing for Two Samples4h 50m
- Two Proportions1h 13m
- Two Proportions Hypothesis Test - Excel28m
- Two Means - Unknown, Unequal Variance1h 3m
- Two Means - Unknown Variances Hypothesis Test - Excel12m
- Two Means - Unknown, Equal Variance15m
- Two Means - Unknown, Equal Variances Hypothesis Test - Excel9m
- Two Means - Known Variance12m
- Two Means - Sigma Known Hypothesis Test - Excel21m
- Two Means - Matched Pairs (Dependent Samples)42m
- Matched Pairs Hypothesis Test - Excel12m
- 11. Correlation1h 24m
- 12. Regression1h 50m
- 13. Chi-Square Tests & Goodness of Fit2h 21m
- 14. ANOVA1h 57m
1. Intro to Stats and Collecting Data
Intro to Stats
Problem 8.1.44a
Textbook Question
Bull Markets A bull market is defined as a market condition in which the price of a security rises for an extended period of time. A bull market in the stock market is often defined as a condition in which a market rises by 20% or more without a 20% decline. The data to the right represent the number of months and percentage change in the S&P 500 (a group of 500 stocks) during the 25 bull markets dating back to 1929 (the year of the famous market crash).
a. Treating the length of the bull market as the explanatory variable, draw a scatter diagram of the data.

Verified step by step guidance1
Step 1: Identify the variables for the scatter plot. The explanatory variable (independent variable) is the length of the bull market in months ("Bull Months"), and the response variable (dependent variable) is the percentage change in the S&P 500 ("Percent Change").
Step 2: Set up the coordinate system for the scatter plot. Label the horizontal axis (x-axis) as "Bull Months" and the vertical axis (y-axis) as "Percent Change".
Step 3: For each bull market data point, plot a point on the graph where the x-coordinate corresponds to the "Bull Months" value and the y-coordinate corresponds to the "Percent Change" value. For example, the first data point is (4.9, 46.77), so place a point at x=4.9 and y=46.77.
Step 4: Repeat the plotting for all 25 data points from the table, ensuring each point accurately represents the pair of values from the two columns.
Step 5: After plotting all points, review the scatter diagram to observe any patterns or relationships between the length of the bull market and the percent change in the S&P 500.
Verified video answer for a similar problem:This video solution was recommended by our tutors as helpful for the problem above
Video duration:
1mPlay a video:
Was this helpful?
Key Concepts
Here are the essential concepts you must grasp in order to answer the question correctly.
Scatter Diagram
A scatter diagram is a graphical representation that displays the relationship between two quantitative variables. Each point on the plot corresponds to one observation with coordinates representing values of the explanatory and response variables. It helps visualize patterns, trends, or correlations between variables, such as the length of bull markets and their percent changes.
Recommended video:
Probability of Mutually Exclusive Events
Explanatory and Response Variables
In statistical analysis, the explanatory variable (independent variable) is the factor that is manipulated or categorized to observe its effect on another variable, called the response variable (dependent variable). Here, the length of the bull market (months) is the explanatory variable, and the percent change in the S&P 500 is the response variable.
Recommended video:
Guided course
Intro to Random Variables & Probability Distributions
Correlation and Association
Correlation measures the strength and direction of a linear relationship between two quantitative variables. A positive correlation means that as one variable increases, the other tends to increase as well. Understanding correlation helps interpret the scatter diagram and assess whether longer bull markets are associated with higher percent changes.
Recommended video:
Guided course
Correlation Coefficient
Watch next
Master Introduction to Statistics Channel with a bite sized video explanation from Patrick
Start learningRelated Videos
Related Practice
Textbook Question
7
views
