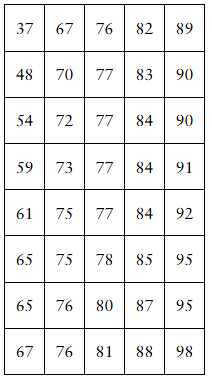
Blood Alcohol Concentration Go to http://www.pearsonhighered.com/sullivanstats to obtain the data 3_1_35. The data represent the blood alcohol concentration (BAC), in percent, of a random sample of drivers involved in fatal car accidents. A BAC of 0 indicates that no alcohol was present. Draw a histogram of the data, describe the shape, and determine the mean and median BAC of drivers in fatal accidents. Which measure of central tendency better describes the typical BAC of drivers in fatal accidents? Explain.
Table of contents
- 1. Intro to Stats and Collecting Data1h 14m
- 2. Describing Data with Tables and Graphs1h 55m
- 3. Describing Data Numerically2h 5m
- 4. Probability2h 16m
- 5. Binomial Distribution & Discrete Random Variables3h 6m
- 6. Normal Distribution and Continuous Random Variables2h 11m
- 7. Sampling Distributions & Confidence Intervals: Mean3h 23m
- Sampling Distribution of the Sample Mean and Central Limit Theorem19m
- Distribution of Sample Mean - Excel23m
- Introduction to Confidence Intervals15m
- Confidence Intervals for Population Mean1h 18m
- Determining the Minimum Sample Size Required12m
- Finding Probabilities and T Critical Values - Excel28m
- Confidence Intervals for Population Means - Excel25m
- 8. Sampling Distributions & Confidence Intervals: Proportion1h 25m
- 9. Hypothesis Testing for One Sample3h 29m
- 10. Hypothesis Testing for Two Samples4h 50m
- Two Proportions1h 13m
- Two Proportions Hypothesis Test - Excel28m
- Two Means - Unknown, Unequal Variance1h 3m
- Two Means - Unknown Variances Hypothesis Test - Excel12m
- Two Means - Unknown, Equal Variance15m
- Two Means - Unknown, Equal Variances Hypothesis Test - Excel9m
- Two Means - Known Variance12m
- Two Means - Sigma Known Hypothesis Test - Excel21m
- Two Means - Matched Pairs (Dependent Samples)42m
- Matched Pairs Hypothesis Test - Excel12m
- 11. Correlation1h 24m
- 12. Regression1h 50m
- 13. Chi-Square Tests & Goodness of Fit2h 21m
- 14. ANOVA1h 57m
3. Describing Data Numerically
Mode
Problem 5.2.46c
Textbook Question
Exam Scores The following data represent the homework scores for the material on Polynomial and Rational Functions in Sullivan’s College Algebra course.

(c) Determine the mean and median score.
Verified step by step guidance1
Step 1: Organize all the homework scores into a single list by reading each row and column from the table. This will give you a complete data set of all the scores.
Step 2: To find the mean score, use the formula for the mean: \(\text{Mean} = \frac{\sum \text{scores}}{\text{number of scores}}\). Add all the scores together and then divide by the total number of scores.
Step 3: To find the median score, first arrange all the scores in ascending order from smallest to largest.
Step 4: Determine the position of the median using the formula \(\text{Median position} = \frac{n+1}{2}\), where \(n\) is the total number of scores. If \(n\) is odd, the median is the score at this position. If \(n\) is even, the median is the average of the two middle scores.
Step 5: Identify the median score from the ordered list using the position found in Step 4. This value represents the middle score of the data set.
Verified video answer for a similar problem:This video solution was recommended by our tutors as helpful for the problem above
Video duration:
3mPlay a video:
Was this helpful?
Key Concepts
Here are the essential concepts you must grasp in order to answer the question correctly.
Mean (Arithmetic Average)
The mean is the sum of all data values divided by the number of values. It provides a measure of central tendency that represents the average score in a data set. The mean is sensitive to extreme values (outliers), which can affect its value.
Recommended video:
Guided course
Calculating the Mean
Median
The median is the middle value when the data set is ordered from smallest to largest. It divides the data into two equal halves and is a measure of central tendency less affected by outliers or skewed data than the mean.
Recommended video:
Guided course
Calculating the Median
Data Organization and Ordering
Organizing data in ascending order is essential for accurately finding the median. Properly arranging the scores helps identify the middle value and ensures correct calculation of statistical measures like mean and median.
Recommended video:
Introduction to Collecting Data
Related Videos
Related Practice
Textbook Question
24
views
