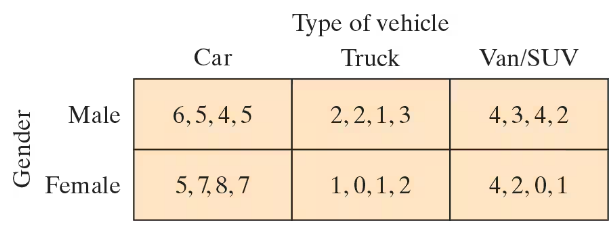
Pulse Rates Shown below are pulse rates from Data Set 1 “Body Data” in Appendix B, and the StatCrunch display from two-way analysis of variance of these data. In analyzing these data, what important feature is addressed with two-way analysis of variance that is not addressed with two separate tests of (1) difference between mean pulse rates based on gender, or (2) differences among the mean pulse rates in the different age brackets?
Table of contents
- 1. Intro to Stats and Collecting Data1h 14m
- 2. Describing Data with Tables and Graphs1h 56m
- 3. Describing Data Numerically2h 5m
- 4. Probability2h 16m
- 5. Binomial Distribution & Discrete Random Variables3h 6m
- 6. Normal Distribution and Continuous Random Variables2h 11m
- 7. Sampling Distributions & Confidence Intervals: Mean3h 23m
- Sampling Distribution of the Sample Mean and Central Limit Theorem19m
- Distribution of Sample Mean - ExcelBonus23m
- Introduction to Confidence Intervals15m
- Confidence Intervals for Population Mean1h 18m
- Determining the Minimum Sample Size Required12m
- Finding Probabilities and T Critical Values - ExcelBonus28m
- Confidence Intervals for Population Means - ExcelBonus25m
- 8. Sampling Distributions & Confidence Intervals: Proportion2h 10m
- 9. Hypothesis Testing for One Sample5h 8m
- Steps in Hypothesis Testing1h 6m
- Performing Hypothesis Tests: Means1h 4m
- Hypothesis Testing: Means - ExcelBonus42m
- Performing Hypothesis Tests: Proportions37m
- Hypothesis Testing: Proportions - ExcelBonus27m
- Performing Hypothesis Tests: Variance12m
- Critical Values and Rejection Regions28m
- Link Between Confidence Intervals and Hypothesis Testing12m
- Type I & Type II Errors16m
- 10. Hypothesis Testing for Two Samples5h 37m
- Two Proportions1h 13m
- Two Proportions Hypothesis Test - ExcelBonus28m
- Two Means - Unknown, Unequal Variance1h 3m
- Two Means - Unknown Variances Hypothesis Test - ExcelBonus12m
- Two Means - Unknown, Equal Variance15m
- Two Means - Unknown, Equal Variances Hypothesis Test - ExcelBonus9m
- Two Means - Known Variance12m
- Two Means - Sigma Known Hypothesis Test - ExcelBonus21m
- Two Means - Matched Pairs (Dependent Samples)42m
- Matched Pairs Hypothesis Test - ExcelBonus12m
- Two Variances and F Distribution29m
- Two Variances - Graphing CalculatorBonus16m
- 11. Correlation1h 24m
- 12. Regression3h 33m
- Linear Regression & Least Squares Method26m
- Residuals12m
- Coefficient of Determination12m
- Regression Line Equation and Coefficient of Determination - ExcelBonus8m
- Finding Residuals and Creating Residual Plots - ExcelBonus11m
- Inferences for Slope31m
- Enabling Data Analysis ToolpakBonus1m
- Regression Readout of the Data Analysis Toolpak - ExcelBonus21m
- Prediction Intervals13m
- Prediction Intervals - ExcelBonus19m
- Multiple Regression - ExcelBonus29m
- Quadratic Regression15m
- Quadratic Regression - ExcelBonus10m
- 13. Chi-Square Tests & Goodness of Fit2h 21m
- 14. ANOVA2h 28m
14. ANOVA
Two-Way ANOVA
Problem 10.4.16
Textbook Question
"Using Technology to Perform a Two-Way ANOVA Test In Exercises 15–18, use technology and the block design to perform a two-way ANOVA test. Use α=0.10. Interpret the results. Assume the samples are random and independent, the populations are normally distributed, and the population variances are equal.
[APPLET] Vehicle Sales The owner of a car dealership wants to determine whether the gender of a salesperson and the type of vehicle sold affect the number of vehicles sold in a month. The block design shows the numbers of vehicles, listed by type, sold in a month by a sample of eight salespeople.

Verified step by step guidance1
Step 1: Organize the data into a two-way ANOVA table format, where the two factors are Gender (Male, Female) and Type of Vehicle (Car, Truck, Van/SUV). Each cell contains the sample data for the number of vehicles sold.
Step 2: Calculate the mean number of vehicles sold for each combination of Gender and Vehicle Type, as well as the overall mean. This helps in understanding the main effects and interaction effects.
Step 3: Use technology (such as statistical software or a graphing calculator) to input the data and perform the two-way ANOVA test. The software will compute the sums of squares, degrees of freedom, mean squares, F-statistics, and p-values for the main effects and interaction effect.
Step 4: Compare the p-values for the main effects (Gender and Vehicle Type) and the interaction effect to the significance level α = 0.10. Determine whether to reject or fail to reject the null hypotheses for each effect.
Step 5: Interpret the results by explaining whether Gender, Vehicle Type, or their interaction significantly affect the number of vehicles sold, based on the ANOVA test outcomes.
Verified video answer for a similar problem:This video solution was recommended by our tutors as helpful for the problem above
Video duration:
2mPlay a video:
0 Comments
Key Concepts
Here are the essential concepts you must grasp in order to answer the question correctly.
Two-Way ANOVA
Two-Way ANOVA is a statistical method used to examine the effect of two independent categorical variables on a continuous dependent variable. It tests for main effects of each factor and their interaction effect, helping to understand if the factors independently or jointly influence the outcome.
Recommended video:
ANOVA Test
Block Design
Block design is an experimental setup that groups subjects into blocks based on a variable to reduce variability and isolate the effect of the factors being studied. In this context, blocking by salesperson helps control for individual differences when analyzing vehicle sales.
Recommended video:
Critical Values: t-Distribution
Assumptions of ANOVA
ANOVA requires assumptions including independence of samples, normal distribution of populations, and equal population variances. These assumptions ensure the validity of the test results and accurate interpretation of the effects of the factors.
Recommended video:
ANOVA Test
Related Videos
Related Practice
Textbook Question
27
views
