"Using Technology to Perform a Two-Way ANOVA Test In Exercises 15–18, use technology and the block design to perform a two-way ANOVA test. Use α=0.10. Interpret the results. Assume the samples are random and independent, the populations are normally distributed, and the population variances are equal.
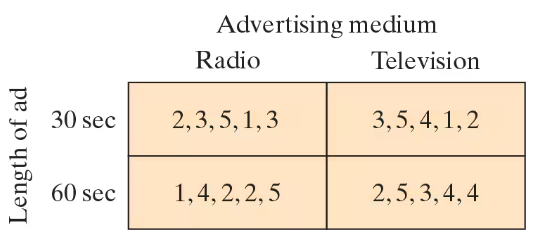
[APPLET] Advertising A study was conducted in which a sample of 20 adults was asked to rate the effectiveness of advertisements. Each adult rated a radio or television advertisement that lasted 30 or 60 seconds. The block design shows these ratings (on a scale of 1 to 5, with 5 being extremely effective).
"
Verified step by step guidance
1
Step 1: Identify the factors and levels in the two-way ANOVA. Here, the two factors are 'Advertising medium' with levels Radio and Television, and 'Length of ad' with levels 30 seconds and 60 seconds.
Step 2: Organize the data into groups based on the combinations of the two factors. The groups are: Radio-30 sec, Radio-60 sec, Television-30 sec, and Television-60 sec, with the given ratings in each group.
Step 3: Use technology (such as statistical software or a graphing calculator) to input the data and perform the two-way ANOVA test. This will calculate the F-statistics and p-values for the main effects of each factor and their interaction effect.
Step 4: Set the significance level α = 0.10 and compare the p-values from the ANOVA output to α to determine if there are statistically significant effects for the advertising medium, length of ad, and their interaction.
Step 5: Interpret the results by stating whether each factor and the interaction have a significant effect on the effectiveness ratings, based on the p-values and the chosen significance level.
Verified video answer for a similar problem:
This video solution was recommended by our tutors as helpful for the problem above
Video duration:
3m
Play a video:
0 Comments
Key Concepts
Here are the essential concepts you must grasp in order to answer the question correctly.
Two-Way ANOVA
Two-way ANOVA is a statistical method used to examine the effect of two independent categorical variables on a continuous dependent variable. It tests for main effects of each factor and their interaction effect, helping to understand if the factors independently or jointly influence the outcome.
Block design is an experimental setup that groups subjects into blocks based on a variable to reduce variability and isolate the effects of the factors being studied. In this question, the length of the ad acts as a blocking factor to control for its influence while assessing the advertising medium.
ANOVA requires assumptions including random and independent samples, normally distributed populations, and equal population variances. These assumptions ensure the validity of the test results and accurate interpretation of the effects of the factors.

 Verified step by step guidance
 05:31
05:31