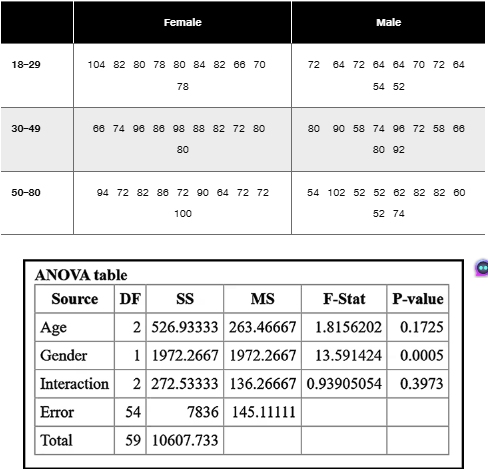
Birth Weights Data Set 6 “Births” includes birth weights (g), hospitals, and the day of the week that mothers were admitted to the hospital. Using rows to represent the four hospitals (Albany Medical Center, Bellevue Hospital Center, Olean General Hospital, Strong Memorial Hospital), and using columns to represent the seven different days of the week, a two-way table has 28 individual cells. Using five birth weights for each of those 28 cells and using StatCrunch for two-way analysis of variance, we get the results displayed below. What do you conclude?
Table of contents
- 1. Intro to Stats and Collecting Data1h 14m
- 2. Describing Data with Tables and Graphs1h 55m
- 3. Describing Data Numerically2h 5m
- 4. Probability2h 16m
- 5. Binomial Distribution & Discrete Random Variables3h 6m
- 6. Normal Distribution and Continuous Random Variables2h 11m
- 7. Sampling Distributions & Confidence Intervals: Mean3h 23m
- Sampling Distribution of the Sample Mean and Central Limit Theorem19m
- Distribution of Sample Mean - Excel23m
- Introduction to Confidence Intervals15m
- Confidence Intervals for Population Mean1h 18m
- Determining the Minimum Sample Size Required12m
- Finding Probabilities and T Critical Values - Excel28m
- Confidence Intervals for Population Means - Excel25m
- 8. Sampling Distributions & Confidence Intervals: Proportion2h 10m
- 9. Hypothesis Testing for One Sample5h 9m
- Steps in Hypothesis Testing1h 6m
- Performing Hypothesis Tests: Means1h 4m
- Hypothesis Testing: Means - Excel42m
- Performing Hypothesis Tests: Proportions37m
- Hypothesis Testing: Proportions - Excel27m
- Performing Hypothesis Tests: Variance12m
- Critical Values and Rejection Regions28m
- Link Between Confidence Intervals and Hypothesis Testing12m
- Type I & Type II Errors17m
- 10. Hypothesis Testing for Two Samples5h 37m
- Two Proportions1h 13m
- Two Proportions Hypothesis Test - Excel28m
- Two Means - Unknown, Unequal Variance1h 3m
- Two Means - Unknown Variances Hypothesis Test - Excel12m
- Two Means - Unknown, Equal Variance15m
- Two Means - Unknown, Equal Variances Hypothesis Test - Excel9m
- Two Means - Known Variance12m
- Two Means - Sigma Known Hypothesis Test - Excel21m
- Two Means - Matched Pairs (Dependent Samples)42m
- Matched Pairs Hypothesis Test - Excel12m
- Two Variances and F Distribution29m
- Two Variances - Graphing Calculator16m
- 11. Correlation1h 24m
- 12. Regression3h 33m
- Linear Regression & Least Squares Method26m
- Residuals12m
- Coefficient of Determination12m
- Regression Line Equation and Coefficient of Determination - Excel8m
- Finding Residuals and Creating Residual Plots - Excel11m
- Inferences for Slope31m
- Enabling Data Analysis Toolpak1m
- Regression Readout of the Data Analysis Toolpak - Excel21m
- Prediction Intervals13m
- Prediction Intervals - Excel19m
- Multiple Regression - Excel29m
- Quadratic Regression15m
- Quadratic Regression - Excel10m
- 13. Chi-Square Tests & Goodness of Fit2h 21m
- 14. ANOVA2h 28m
14. ANOVA
Two-Way ANOVA
Problem 12.Q.8
Textbook Question
Pulse Rates Shown below are pulse rates from Data Set 1 “Body Data” in Appendix B, and the StatCrunch display from two-way analysis of variance of these data. In analyzing these data, what important feature is addressed with two-way analysis of variance that is not addressed with two separate tests of (1) difference between mean pulse rates based on gender, or (2) differences among the mean pulse rates in the different age brackets?

Verified step by step guidance1
Step 1: Understand the purpose of two-way ANOVA. Two-way analysis of variance (ANOVA) is used to examine the effect of two different categorical independent variables (factors) on a continuous dependent variable, and also to check if there is an interaction effect between these two factors.
Step 2: Identify the factors in the problem. Here, the two factors are 'Age' (with three groups: 18-29, 30-49, 50-80) and 'Gender' (with two groups: Female and Male). The dependent variable is the pulse rate.
Step 3: Recognize what separate tests would do. Conducting separate tests for (1) difference between mean pulse rates based on gender and (2) differences among mean pulse rates in different age brackets would only analyze the main effects independently, ignoring any possible interaction between age and gender.
Step 4: Understand the interaction term in two-way ANOVA. The interaction term tests whether the effect of one factor (e.g., gender) on pulse rate depends on the level of the other factor (e.g., age group). This is an important feature that separate one-way ANOVAs or t-tests cannot detect.
Step 5: Conclude the importance of two-way ANOVA. By using two-way ANOVA, you can simultaneously test for the main effects of age and gender and also determine if there is a significant interaction effect between age and gender on pulse rates, providing a more comprehensive analysis.
Verified video answer for a similar problem:This video solution was recommended by our tutors as helpful for the problem above
Video duration:
1mPlay a video:
Was this helpful?
Key Concepts
Here are the essential concepts you must grasp in order to answer the question correctly.
Two-Way Analysis of Variance (ANOVA)
Two-way ANOVA is a statistical method used to examine the effect of two independent categorical variables on a continuous dependent variable simultaneously. It allows testing for main effects of each factor and their interaction effect, providing a more comprehensive analysis than separate one-way ANOVAs.
Recommended video:
Introduction to ANOVA
Interaction Effect
The interaction effect in two-way ANOVA tests whether the effect of one factor depends on the level of the other factor. This is important because it reveals if the combined influence of factors differs from their individual effects, which cannot be detected by separate tests.
Recommended video:
Finding Binomial Probabilities Using TI-84 Example 1
Main Effects vs. Interaction
Main effects refer to the individual impact of each factor (e.g., age or gender) on the response variable, while interaction effects show how factors jointly influence the response. Two-way ANOVA distinguishes these effects, unlike separate tests that only assess main effects independently.
Recommended video:
Guided course
Visualizing Qualitative vs. Quantitative Data
Watch next
Master Intro to Two-Way ANOVA & Two-Way Tables with a bite sized video explanation from Patrick
Start learningRelated Videos
Related Practice
Textbook Question
5
views
