


Ch. 5 - Normal Probability Distributions
Larson - Elementary Statistics: Picturing the World 8th Edition
Larson8th EditionElementary Statistics: Picturing the WorldISBN: 9780137493470Not the one you use?Change textbook
Chapter 5, Problem 5.3.34b

Finding Specified Data Values In Exercises 31–38, answer the questions about the specified normal distribution.


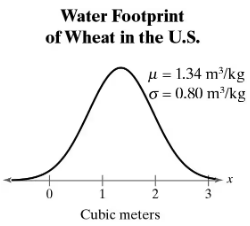
Water Footprint A water footprint is a measure of the appropriation of fresh water. The water footprint (in cubic meters) for a kilogram of wheat can be approximated by a normal distribution, as shown in the figure. (Source: Ecological Indicators)


.3


b. What water footprint represents the 29th percentile?

Verified step by step guidance
1
Step 1: Understand the problem. The question asks for the water footprint value that corresponds to the 29th percentile in a normal distribution. The normal distribution is defined by a mean (μ = 1.34 m³/kg) and a standard deviation (σ = 0.80 m³/kg). Percentiles represent the position of a value in the distribution relative to the rest of the data.
Step 2: Convert the percentile into a z-score. The z-score is a standardized value that corresponds to the given percentile in the standard normal distribution. Use a z-score table or statistical software to find the z-score for the 29th percentile. For example, the z-score for the 29th percentile is approximately -0.55.
Step 3: Use the z-score formula to find the corresponding value in the normal distribution. The formula is: x = μ + zσ, where x is the value in the normal distribution, μ is the mean, z is the z-score, and σ is the standard deviation.
Step 4: Substitute the values into the formula. Plug in μ = 1.34, z = -0.55, and σ = 0.80 into the formula x = μ + zσ.
Step 5: Simplify the expression to find the water footprint value corresponding to the 29th percentile. This will give you the final result in cubic meters.

Verified video answer for a similar problem:

This video solution was recommended by our tutors as helpful for the problem above.
Video duration:
2m
Was this helpful?

Key Concepts

Here are the essential concepts you must grasp in order to answer the question correctly.

Normal Distribution

A normal distribution is a continuous probability distribution characterized by its bell-shaped curve, defined by its mean (μ) and standard deviation (σ). In this context, the water footprint of wheat follows a normal distribution, indicating that most values cluster around the mean, with fewer occurrences as you move away from it.
Recommended video:
06:23
Using the Normal Distribution to Approximate Binomial Probabilities

Percentiles

A percentile is a measure used in statistics to indicate the value below which a given percentage of observations fall. For example, the 29th percentile represents the value below which 29% of the data points lie. Understanding percentiles is crucial for interpreting the distribution of data and identifying specific thresholds.

Z-scores

A Z-score is a statistical measurement that describes a value's relationship to the mean of a group of values, expressed in terms of standard deviations. It is calculated by subtracting the mean from the value and dividing by the standard deviation. Z-scores are essential for finding percentiles in a normal distribution, as they allow for the conversion of raw scores into a standardized format.
Recommended video:
Guided course
06:31
Z-Scores From Given Probability - TI-84 (CE) Calculator
Related Practice
Textbook Question

Finding Probabilities for Normal Distributions In Exercises 7–12, find the indicated probabilities. If convenient, use technology to find the probabilities.


Health Club Schedule The amounts of time per workout an athlete uses a stairclimber are normally distributed, with a mean of 20 minutes and a standard deviation of 5 minutes. Find the probability that a randomly selected athlete uses a stairclimber for (b) between 20 and 28 minutes.

111
views
Textbook Question

Finding Specified Data Values In Exercises 31–38, answer the questions about the specified normal distribution.


Advanced Dental Admission Test The Advanced Dental Admission Test (ADAT) is designed so that the scores fit a normal distribution, as shown in the figure. (Source: American Dental Association)


b. Between what two values does the middle 50% of the ADAT scores lie?

108
views
Textbook Question

Approximating Binomial Probabilities In Exercises 19–26, determine whether you can use a normal distribution to approximate the binomial distribution. If you can, use the normal distribution to approximate the indicated probabilities and sketch their graphs. If you cannot, explain why and use a binomial distribution to find the indicated probabilities. Identify any unusual events. Explain.


Advancing Research In a survey of U.S. adults, 77% said are willing to share their personal health information to advance medical research. You randomly select 500 U.S. adults. Find the probability that the number who are willing to share their personal health information to advance medical research is (b) more than 360

77
views
Textbook Question

Finding Specified Data Values In Exercises 31–38, answer the questions about the specified normal distribution.


Billboard Hot 100 The length (in seconds) of the 100 most popular songs during the week of May 5, 2021, can be approximated by a normal distribution, as shown in the figure. (Source: Spotify)


b. What song length represents the 17th percentile?

115
views
Textbook Question

Approximating Binomial Probabilities In Exercises 19–26, determine whether you can use a normal distribution to approximate the binomial distribution. If you can, use the normal distribution to approximate the indicated probabilities and sketch their graphs. If you cannot, explain why and use a binomial distribution to find the indicated probabilities. Identify any unusual events. Explain.


Social Media A survey of Americans found that 55% would be disappointed if Facebook disappeared. You randomly select 500 Americans and ask them whether they would be disappointed if Facebook disappeared. Find the probability that the number who say yes is (b) at least 300

100
views
Textbook Question

SAT Total Scores Use the normal distribution in Exercise 13.

b. Out of 1000 randomly selected SAT total scores, about how many would you expect to be greater than 1100?

106
views