Why do we use a pooled estimate of the population proportion when testing a hypothesis about two proportions? Why do we not use a pooled estimate of the population proportion when constructing a confidence interval for the difference of two proportions?
Verified step by step guidance
1
Understand that when testing a hypothesis about two population proportions, the null hypothesis usually states that the two proportions are equal, i.e., \(H_0: p_1 = p_2\).
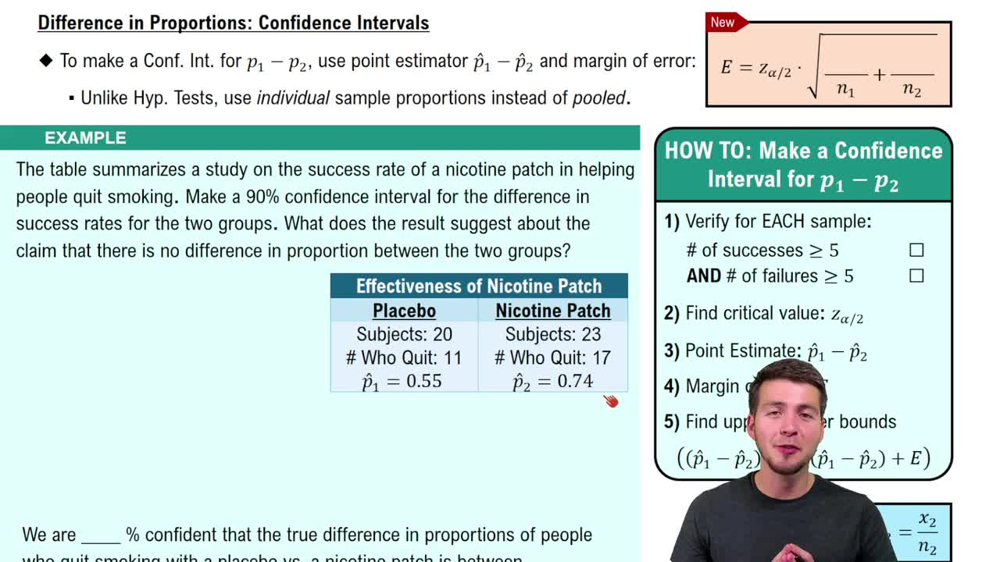
Because the null hypothesis assumes the proportions are the same, we combine (or pool) the data from both samples to get a single estimate of the common population proportion. This pooled estimate is calculated as \(\hat{p} = \frac{x_1 + x_2}{n_1 + n_2}\), where \(x_1\) and \(x_2\) are the number of successes in each sample, and \(n_1\) and \(n_2\) are the sample sizes.
Using the pooled estimate under the null hypothesis provides a more accurate estimate of the common proportion, which is essential for calculating the standard error of the difference in sample proportions when performing the hypothesis test.
In contrast, when constructing a confidence interval for the difference between two proportions, we do not assume the proportions are equal. Instead, we estimate each proportion separately using \(\hat{p}_1 = \frac{x_1}{n_1}\) and \(\hat{p}_2 = \frac{x_2}{n_2}\).
Because the confidence interval aims to estimate the true difference without assuming equality, we use the separate sample proportions to calculate the standard error, which reflects the variability in each sample independently, rather than pooling them.
Verified video answer for a similar problem:
This video solution was recommended by our tutors as helpful for the problem above
Video duration:
2m
Play a video:
0 Comments
Key Concepts
Here are the essential concepts you must grasp in order to answer the question correctly.
Pooled Estimate of Population Proportion
A pooled estimate combines data from two samples to calculate a single proportion, assuming the null hypothesis that the two population proportions are equal. This combined proportion provides a more accurate estimate of the common proportion under the null, improving the test's validity.
Finding a Confidence Interval for a Population Proportion Using a TI84
Hypothesis Testing for Two Proportions
In hypothesis testing, the goal is to determine if there is enough evidence to reject the assumption that two population proportions are equal. Using a pooled estimate under the null hypothesis helps standardize the test statistic and reflects the assumption that both groups share the same proportion.
Confidence Interval for Difference of Two Proportions
When constructing a confidence interval, the focus is on estimating the true difference between two population proportions without assuming they are equal. Therefore, separate sample proportions are used to capture the variability in each group, providing an unbiased range for the difference.

 Verified step by step guidance
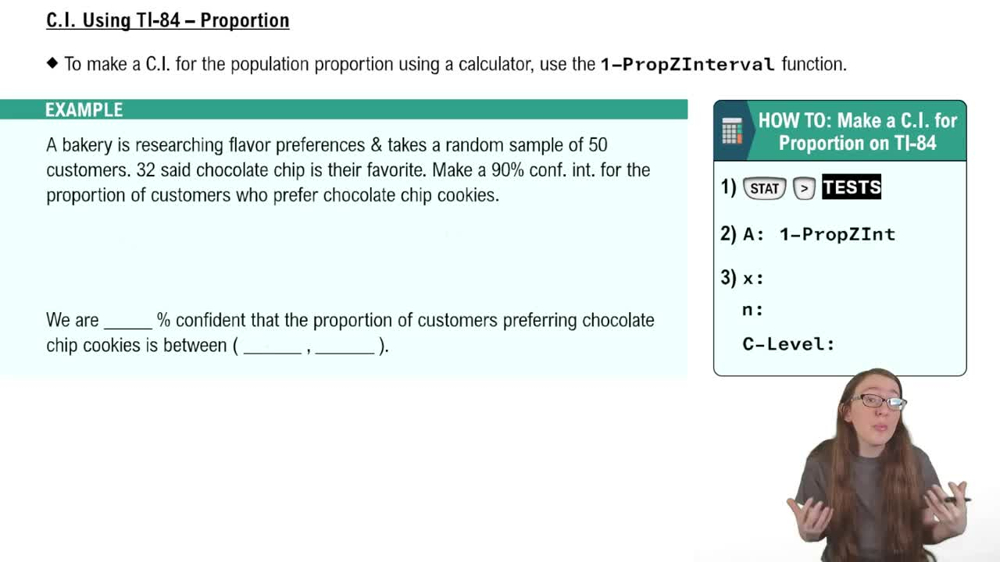
 02:35
02:35