Using a standard normal distribution, what is the -score such that the area to the left of is ?
Table of contents
- 1. Intro to Stats and Collecting Data1h 14m
- 2. Describing Data with Tables and Graphs1h 55m
- 3. Describing Data Numerically2h 5m
- 4. Probability2h 16m
- 5. Binomial Distribution & Discrete Random Variables3h 6m
- 6. Normal Distribution and Continuous Random Variables2h 11m
- 7. Sampling Distributions & Confidence Intervals: Mean3h 23m
- Sampling Distribution of the Sample Mean and Central Limit Theorem19m
- Distribution of Sample Mean - Excel23m
- Introduction to Confidence Intervals15m
- Confidence Intervals for Population Mean1h 18m
- Determining the Minimum Sample Size Required12m
- Finding Probabilities and T Critical Values - Excel28m
- Confidence Intervals for Population Means - Excel25m
- 8. Sampling Distributions & Confidence Intervals: Proportion1h 25m
- 9. Hypothesis Testing for One Sample3h 29m
- 10. Hypothesis Testing for Two Samples4h 50m
- Two Proportions1h 13m
- Two Proportions Hypothesis Test - Excel28m
- Two Means - Unknown, Unequal Variance1h 3m
- Two Means - Unknown Variances Hypothesis Test - Excel12m
- Two Means - Unknown, Equal Variance15m
- Two Means - Unknown, Equal Variances Hypothesis Test - Excel9m
- Two Means - Known Variance12m
- Two Means - Sigma Known Hypothesis Test - Excel21m
- Two Means - Matched Pairs (Dependent Samples)42m
- Matched Pairs Hypothesis Test - Excel12m
- 11. Correlation1h 24m
- 12. Regression1h 50m
- 13. Chi-Square Tests & Goodness of Fit2h 21m
- 14. ANOVA1h 57m
6. Normal Distribution and Continuous Random Variables
Probabilities & Z-Scores w/ Graphing Calculator
Struggling with Statistics?
Join thousands of students who trust us to help them ace their exams!Watch the first videoMultiple Choice
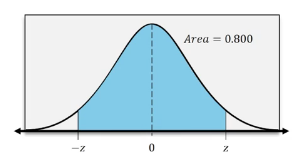
Use a calculator to find the z–scores of the region shown in the standard normal distribution below.
A = 0.800

A
z=−0.26,z=0.26
B
z=−0.25,z=0.25
C
z=−0.805,z=0.805
D
z=−1.28,z=1.28
Verified step by step guidance1
Begin by understanding that the problem involves finding the z-scores that correspond to a central area of 0.800 under the standard normal distribution curve.
Sketch a standard normal distribution curve, which is symmetric around the mean (0). The area under the curve represents probabilities, and the total area is 1.
Identify that the shaded area in the graph is 0.800, which is the probability between the two z-scores, -z and z. This means that the tails on either side of the shaded area have a combined probability of 0.200.
Divide the tail area by 2 to find the probability in each tail: 0.200 / 2 = 0.100. This is the area in each tail beyond the z-scores.
Use a standard normal distribution table or calculator to find the z-score that corresponds to a cumulative probability of 0.100 in the left tail. This z-score will be negative, and its positive counterpart will be the z-score for the right tail. The correct z-scores are approximately -1.28 and 1.28.
Watch next
Master Probability From Given Z-Scores - TI-84 (CE) Calculator with a bite sized video explanation from Patrick
Start learningRelated Videos
Related Practice
Multiple Choice
13
views
Probabilities & Z-Scores w/ Graphing Calculator practice set

