

Ch. 10 - Chi-Square Tests and the F-Distribution
Larson - Elementary Statistics: Picturing the World 8th Edition
Larson8th EditionElementary Statistics: Picturing the WorldISBN: 9780137493470Not the one you use?Change textbook
Chapter 10, Problem 10.2.41

Conditional Relative Frequencies In Exercises 37–42, use the contingency table from Exercises 33–36, and the information below.
Relative frequencies can also be calculated based on the row totals (by dividing each row entry by the row’s total) or the column totals (by dividing each column entry by the column’s total). These frequencies are conditional relative frequencies and can be used to determine whether an association exists between two categories in a contingency table.


What percent of U.S. adults ages 25 and over who have a degree are not in the civilian labor force?

Verified step by step guidance
1
Step 1: Identify the relevant data from the contingency table. Locate the row corresponding to U.S. adults ages 25 and over who have a degree and the column corresponding to those not in the civilian labor force.
Step 2: Find the total number of U.S. adults ages 25 and over who have a degree (row total). This will be used as the denominator for calculating the conditional relative frequency.
Step 3: Extract the specific value from the contingency table that represents the number of U.S. adults ages 25 and over who have a degree and are not in the civilian labor force. This will be the numerator for the calculation.
Step 4: Calculate the conditional relative frequency by dividing the numerator (number of individuals with a degree not in the civilian labor force) by the denominator (total number of individuals with a degree). Use the formula: NumeratorDenominator
Step 5: Convert the conditional relative frequency into a percentage by multiplying the result by 100. Use the formula: Percentage = NumeratorDenominator × 100

Verified video answer for a similar problem:

This video solution was recommended by our tutors as helpful for the problem above.
Video duration:
3m
Was this helpful?

Key Concepts

Here are the essential concepts you must grasp in order to answer the question correctly.

Contingency Table

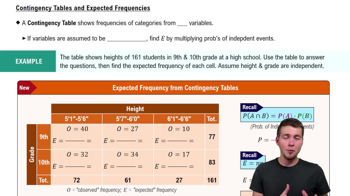
A contingency table is a type of data representation that displays the frequency distribution of variables. It allows for the examination of the relationship between two categorical variables by showing how the frequencies of one variable are distributed across the categories of another. Each cell in the table represents the count of occurrences for a specific combination of categories, facilitating the analysis of potential associations.
Recommended video:
Guided course
08:18
Contingency Tables & Expected Frequencies

Relative Frequency

Relative frequency is a statistical measure that expresses the frequency of a particular event or category as a proportion of the total number of observations. It is calculated by dividing the count of occurrences of a specific category by the total number of observations. This concept is crucial for understanding the distribution of data and making comparisons between different categories within a dataset.
Recommended video:
Guided course
06:38
Intro to Frequency Distributions

Conditional Relative Frequency

Conditional relative frequency refers to the relative frequency of a category given a specific condition or subset of data. It is calculated by dividing the frequency of a particular category by the total frequency of the condition being considered, such as row or column totals in a contingency table. This concept helps in assessing the relationship between two categorical variables and determining if an association exists.
Recommended video:
Guided course
06:38
Intro to Frequency Distributions
Related Practice
Textbook Question

Performing a Chi-Square Goodness-of-Fit Test

In Exercises 7–16, (a) identify the claim and state H₀ and Hₐ, (b) find the critical value and identify the rejection region, (c) find the chi-square test statistic, (d) decide whether to reject or fail to reject the null hypothesis, and (e) interpret the decision in the context of the original claim.


Coffee A researcher claims that the numbers of cups of coffee U.S. adults drink per day are distributed as shown in the figure. You randomly select 1600 U.S. adults and ask them how many cups of coffee they drink per day. The table shows the results. At α=0.05, test the researcher’s claim. (Adapted from Gallup)


97
views
Textbook Question

"In Exercises 13–18, test the claim about the difference between two population variances σ₁² and σ₂² at the level of significance α. Assume the samples are random and independent, and the populations are normally distributed.


Claim: σ₁² > σ₂²; α = 0.10.

Sample statistics: s₁² = 773, n₁ = 5 and s₂² = 765, n₂ = 6"

49
views
Textbook Question

Finding Expected Frequencies

In Exercises 3–6, find the expected frequency for the values of n and pᵢ.


n=230, pᵢ=0.25

118
views
Textbook Question

Finding Expected Frequencies

In Exercises 3–6, find the expected frequency for the values of n and pᵢ.


n=415, pᵢ=0.08

126
views
Textbook Question

"Finding a Critical F-Value for a Two-Tailed Test In Exercises 9–12, find the critical F-value for a two-tailed test using the level of significance α and degrees of freedom d.f.N and d.f.D.


α=0.10, d.f.N=24, d.f.D=28"

88
views
Textbook Question

Describe the difference between the variance between samples MSB and the variance within samples MSW.

146
views