
Textbook Question
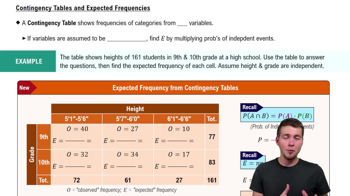
Explain why the chi-square independence test is always a right-tailed test.
203
views

 Verified step by step guidance
 08:18
08:18
 06:38
06:38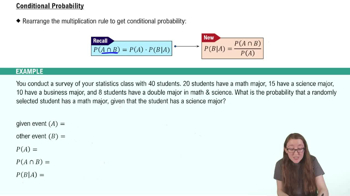 03:53
03:53Explain why the chi-square independence test is always a right-tailed test.
Performing a One-Way ANOVA Test In Exercises 5–14, (a) identify the claim and state H0 and Ha, (b) find the critical value and identify the rejection region, (c) find the test statistic F, (d) decide whether to reject or fail to reject the null hypothesis, and (e) interpret the decision in the context of the original claim. Assume the samples are random and independent, the populations are normally distributed, and the population variances are equal.
[APPLET] Statistician Salaries The table shows the salaries of a sample of entry level statisticians from six large metropolitan areas. At α=0.05, can you conclude that the mean salary is different in at least one of the areas? (Adapted from Salary.com)
Finding a Critical F-Value for a Right-Tailed Test In Exercises 5–8, find the critical F-value for a right-tailed test using the level of significance α and degrees of freedom d.f.N and d.f.D.
α=0.10, d.f.N=10, d.f.D=15
List five properties of the F-distribution.
Explain how to determine the values of d.f.N and d.f.D when performing a two-sample F-test.
In Exercises 13–18, test the claim about the difference between two population variances σ₁² and σ₂² at the level of significance α. Assume the samples are random and independent, and the populations are normally distributed.
Claim: σ₁² > σ₂²; α = 0.05.
Sample statistics: s₁² = 44.6, n₁ = 16 and s₂² = 39.3, n₂ = 12