


Ch. 6 - Normal Probability Distributions
Triola - Elementary Statistics 14th Edition
Triola14th EditionElementary StatisticsISBN: 9780137366446Not the one you use?Change textbook
Chapter 6, Problem 6.5.5

Interpreting Normal Quantile Plots. In Exercises 5–8, examine the normal quantile plot and determine whether the sample data appear to be from a population with a normal distribution.


Ages of Presidents The normal quantile plot represents the ages of presidents of the United States at the times of their inaugurations. The data are from Data Set 22 “Presidents” in Appendix B.

Verified step by step guidance
1
Step 1: Understand the purpose of a normal quantile plot. A normal quantile plot (also called a Q-Q plot) is used to assess whether a dataset follows a normal distribution. If the data points in the plot roughly follow a straight line, the data can be considered approximately normal.
Step 2: Examine the normal quantile plot provided. Look at the arrangement of the data points. If the points deviate significantly from a straight line (e.g., they form a curve or have outliers), this suggests that the data may not come from a normal distribution.
Step 3: Check for patterns in the deviations. If the points systematically curve upward or downward, this could indicate skewness in the data. If there are clusters of points or large gaps, this might suggest other non-normal characteristics.
Step 4: Consider the context of the data. The ages of U.S. presidents at inauguration may have historical or societal factors influencing their distribution. For example, if there are age limits or trends over time, these could affect normality.
Step 5: Conclude based on the visual inspection. If the points closely follow a straight line, you can reasonably conclude that the data appear to come from a normal distribution. If not, the data may not be normal, and further statistical tests (e.g., Shapiro-Wilk or Anderson-Darling tests) could be used to confirm this.

Verified video answer for a similar problem:

This video solution was recommended by our tutors as helpful for the problem above.
Video duration:
1m
Was this helpful?

Key Concepts

Here are the essential concepts you must grasp in order to answer the question correctly.

Normal Distribution

Normal distribution is a probability distribution that is symmetric about the mean, showing that data near the mean are more frequent in occurrence than data far from the mean. It is characterized by its bell-shaped curve and is defined by two parameters: the mean (average) and the standard deviation (spread). Understanding this concept is crucial for interpreting normal quantile plots, as they are used to assess whether a dataset follows this distribution.
Recommended video:
Guided course
09:47
Finding Standard Normal Probabilities using z-Table

Quantile Plot

A quantile plot is a graphical tool used to compare the distribution of a dataset to a theoretical distribution, such as the normal distribution. In a normal quantile plot, the quantiles of the sample data are plotted against the quantiles of a normal distribution. If the points on the plot form a straight line, it suggests that the sample data follows a normal distribution, while deviations from this line indicate departures from normality.
Recommended video:
04:01
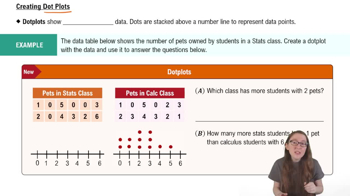
Creating Dotplots

Outliers

Outliers are data points that differ significantly from other observations in a dataset. They can indicate variability in the measurement, experimental errors, or a novel phenomenon. In the context of normal quantile plots, the presence of outliers can distort the appearance of the plot, making it essential to identify and consider them when assessing whether the data follows a normal distribution.
Recommended video:
Guided course
04:48
Comparing Mean vs. Median
Related Practice
Textbook Question

Good Sample? An economist is investigating the incomes of college students. Because she lives in Maine, she obtains sample data from that state. Is the resulting mean income of college students a good estimator of the mean income of college students in the United States? Why or why not?

111
views
Textbook Question

Continuous Uniform Distribution. In Exercises 5–8, refer to the continuous uniform distribution depicted in Figure 6-2 and described in Example 1. Assume that a passenger is randomly selected, and find the probability that the waiting time is within the given range.


" style="" width="225">


Greater than 3.00 minutes

363
views
Textbook Question

Pulse Rates. In Exercises 13–24, use the data in the table below for pulse rates of adult males and females (based on Data Set 1 “Body Data” in Appendix B). Hint: Draw a graph in each case.


" style="" width="340">


For males, find P90 which is the pulse rate separating the bottom 90% from the top 10%.

271
views
Textbook Question

IQ Scores. In Exercises 5–8, find the area of the shaded region. The graphs depict IQ scores of adults, and those scores are normally distributed with a mean of 100 and a standard deviation of 15 (as on the Wechsler IQ test).

230
views
Textbook Question

Critical Values. In Exercises 41–44, find the indicated critical value. Round results to two decimal places.


z0.90

230
views
Textbook Question

Overbooking a Boeing 767-300 A Boeing 767-300 aircraft has 213 seats. When someone buys a ticket for a flight, there is a 0.0995 probability that the person will not show up for the flight (based on data from an IBM research paper by Lawrence, Hong, and Cherrier). How many reservations could be accepted for a Boeing 767-300 for there to be at least a 0.95 probability that all reservation holders who show will be accommodated?

182
views