Ch. 2 - Descriptive Statistics
Larson - Elementary Statistics: Picturing the World 8th Edition
Larson8th EditionElementary Statistics: Picturing the WorldISBN: 9780137493470Not the one you use?Change textbook
Chapter 2, Problem 2.5.22

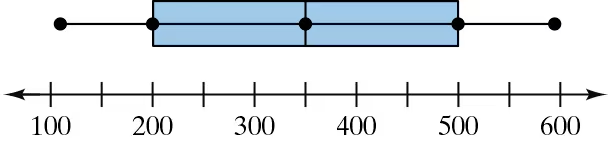
Graphical Analysis In Exercises 19–22, use the box-and-whisker plot to determine whether the shape of the distribution represented is symmetric, skewed left, skewed right, or none of these. Justify your answer.
Box-and-whisker plot showing data distribution with a range from 100 to 600, highlighting median and quartiles.

Verified step by step guidance
1
Examine the box-and-whisker plot carefully. Note the positions of the minimum, maximum, median, and quartiles (Q1 and Q3). These elements help determine the shape of the distribution.
Check the length of the whiskers on both sides of the box. If the whiskers are approximately equal in length, the distribution is likely symmetric. If one whisker is longer, the distribution may be skewed.
Observe the position of the median within the box. If the median is roughly centered between Q1 and Q3, the distribution is symmetric. If the median is closer to Q1 or Q3, the distribution may be skewed.
Compare the spacing between Q1, Q3, and the whiskers. Unequal spacing can indicate skewness. For example, if the spacing is larger on the left side, the distribution is skewed left; if larger on the right side, it is skewed right.
Based on the observations above, determine whether the distribution is symmetric, skewed left, skewed right, or none of these. Justify your conclusion using the visual characteristics of the box-and-whisker plot.

Verified video answer for a similar problem:

This video solution was recommended by our tutors as helpful for the problem above.
Video duration:
2m
Was this helpful?

Key Concepts

Here are the essential concepts you must grasp in order to answer the question correctly.

Box-and-Whisker Plot

A box-and-whisker plot is a graphical representation of a dataset that displays its minimum, first quartile, median, third quartile, and maximum. The 'box' shows the interquartile range (IQR), which contains the middle 50% of the data, while the 'whiskers' extend to the minimum and maximum values. This plot helps visualize the distribution's spread and central tendency.
Recommended video:
03:54
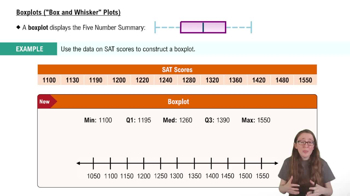
Boxplots ("Box and Whisker Plots")

Distribution Shape

The shape of a distribution refers to how data points are spread across the range of values. Common shapes include symmetric, where data is evenly distributed around the center; skewed left, where more data points fall on the higher end; and skewed right, where more data points are on the lower end. Understanding the shape is crucial for interpreting data characteristics and making statistical inferences.
Recommended video:
05:11
Sampling Distribution of Sample Proportion

Quartiles and Median

Quartiles divide a dataset into four equal parts, with the first quartile (Q1) being the median of the lower half, the second quartile (Q2) being the overall median, and the third quartile (Q3) being the median of the upper half. The median provides a measure of central tendency, while quartiles help assess the spread and identify potential outliers in the data.
Recommended video:
07:11
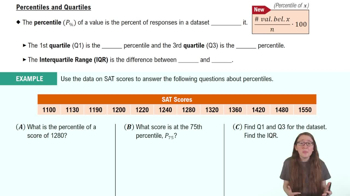
Percentiles and Quartiles