

Ch. 3 - Probability
Larson - Elementary Statistics: Picturing the World 8th Edition
Larson8th EditionElementary Statistics: Picturing the WorldISBN: 9780137493470Not the one you use?Change textbook
Chapter 3, Problem 3.1.26

"Identifying the Sample Space of a Probability Experiment In Exercises 25-32, identify the sample space of the probability experiment and determine the number of outcomes in the sample space. Draw a tree diagram when appropriate.
26. Guessing a student's letter grade (A, B, C, D, F) in a class
"

Verified step by step guidance
1
Understand the problem: The task is to identify the sample space of a probability experiment where you are guessing a student's letter grade in a class. The sample space is the set of all possible outcomes of the experiment.
List all possible outcomes: In this case, the possible letter grades are A, B, C, D, and F. These represent the complete set of outcomes for the experiment.
Define the sample space: The sample space is the set of all possible outcomes. Using set notation, the sample space can be written as S = {A, B, C, D, F}.
Count the number of outcomes: The number of outcomes in the sample space is equal to the number of elements in the set S. In this case, there are 5 outcomes.
Determine if a tree diagram is needed: Since the outcomes are straightforward and there are no sequential decisions or branching, a tree diagram is not necessary for this problem.

Verified video answer for a similar problem:

This video solution was recommended by our tutors as helpful for the problem above.
Video duration:
1m
Was this helpful?

Key Concepts

Here are the essential concepts you must grasp in order to answer the question correctly.

Sample Space

The sample space in probability is the set of all possible outcomes of a given experiment. For the example of guessing a student's letter grade, the sample space consists of the grades A, B, C, D, and F. Understanding the sample space is crucial as it forms the foundation for calculating probabilities and analyzing outcomes.
Recommended video:
05:11
Sampling Distribution of Sample Proportion

Outcomes

An outcome is a specific result of a probability experiment. In the context of guessing a student's letter grade, each letter grade represents a distinct outcome. The total number of outcomes in the sample space is essential for determining the likelihood of each event occurring, which is a fundamental aspect of probability.
Recommended video:
Guided course
06:00
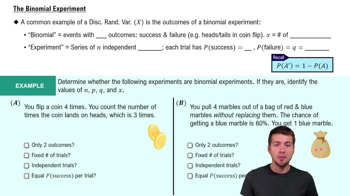
The Binomial Experiment

Tree Diagram

A tree diagram is a visual representation used to illustrate all possible outcomes of a probability experiment. It branches out from a starting point, showing each possible outcome at each stage. In this case, a tree diagram can help visualize the different letter grades a student might receive, making it easier to understand the sample space and the relationships between outcomes.
Recommended video:
5:14
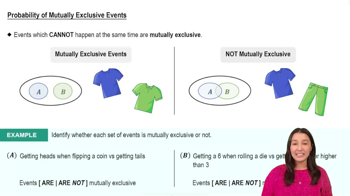
Probability of Mutually Exclusive Events
Related Practice
Textbook Question

"Classifying Events Based on Studies In Exercises 15-18, identify the two events described in the study. Do the results indicate that the events are independent or dependent? Explain your reasoning.

15. A study was conducted to debunk the idea that abilities in music and math are related. Instead, the study showed a strong relationship between achievements in music and math.

(Source: University of Kansas)"

59
views
Textbook Question

Classifying Events as Independent or Dependent In Exercises 9-14, determine whether the events are independent or dependent. Explain your reasoning.

11. Returning a rented movie after the due date and receiving a late fee

109
views
Textbook Question

"Using the Multiplication Rule In Exercises 19-32, use the Multiplication Rule.

22.Pickup Trucks In a survey, 510 U.S. adults were asked whether they drive a pickup truck and whether they drive a Ford. The results showed that three in twenty adults surveyed drive a Ford. Of the adults surveyed that drive Fords, nine in twenty drive a pickup truck. Find the probability that a randomly selected adult drives a Ford and drives a pickup truck.

82
views
Textbook Question

True or False? In Exercises 7-10, determine whether the statement is true or false. If it is false, rewrite it as a true statement.

9. A probability of 1/10 indicates an unusual event.

102
views
Textbook Question

"According to Bayes’ Theorem, the probability of event A , given that event B has occurred, is

P(A|B) = P(A) * P(B|A)P(A) * P(B|A) + P(A') * P(B|A').

In Exercises 33–38, use Bayes’ Theorem to find P(A|B).

38. P(A) = 12%, P(A') = 88%, P(B|A) = 66% , and P(B|A') = 19% "

80
views
Textbook Question

Classifying Types of Probability In Exercises 53-58, classify the statement as an example of classical probability, empirical probability, or subjective probability. Explain your reasoning.

58. You estimate that the probability of getting all the classes you want on your next schedule

is about 25%.

150
views