Suppose a simple random sample of size n is drawn from a large population with mean μ and standard deviation σ. The sampling distribution of x̄ has mean μx̄ = _________ and standard deviation σx̄ = ________.
Table of contents
- 1. Intro to Stats and Collecting Data1h 14m
- 2. Describing Data with Tables and Graphs1h 55m
- 3. Describing Data Numerically2h 5m
- 4. Probability2h 16m
- 5. Binomial Distribution & Discrete Random Variables3h 6m
- 6. Normal Distribution and Continuous Random Variables2h 11m
- 7. Sampling Distributions & Confidence Intervals: Mean3h 23m
- Sampling Distribution of the Sample Mean and Central Limit Theorem19m
- Distribution of Sample Mean - Excel23m
- Introduction to Confidence Intervals15m
- Confidence Intervals for Population Mean1h 18m
- Determining the Minimum Sample Size Required12m
- Finding Probabilities and T Critical Values - Excel28m
- Confidence Intervals for Population Means - Excel25m
- 8. Sampling Distributions & Confidence Intervals: Proportion1h 25m
- 9. Hypothesis Testing for One Sample3h 29m
- 10. Hypothesis Testing for Two Samples4h 50m
- Two Proportions1h 13m
- Two Proportions Hypothesis Test - Excel28m
- Two Means - Unknown, Unequal Variance1h 3m
- Two Means - Unknown Variances Hypothesis Test - Excel12m
- Two Means - Unknown, Equal Variance15m
- Two Means - Unknown, Equal Variances Hypothesis Test - Excel9m
- Two Means - Known Variance12m
- Two Means - Sigma Known Hypothesis Test - Excel21m
- Two Means - Matched Pairs (Dependent Samples)42m
- Matched Pairs Hypothesis Test - Excel12m
- 11. Correlation1h 24m
- 12. Regression1h 50m
- 13. Chi-Square Tests & Goodness of Fit2h 21m
- 14. ANOVA1h 57m
7. Sampling Distributions & Confidence Intervals: Mean
Sampling Distribution of the Sample Mean and Central Limit Theorem
Problem 9.2.50
Textbook Question
The procedure for constructing a t-interval is robust. Explain what this means.
Verified step by step guidance1
Understand that a t-interval is a confidence interval for a population mean when the population standard deviation is unknown and the sample size is relatively small.
Recognize that 'robust' in this context means the procedure still performs well even if certain assumptions, like the population being exactly normally distributed, are not perfectly met.
Know that the t-interval procedure is especially robust to moderate departures from normality, meaning it still provides reliable confidence intervals when the data distribution is slightly skewed or has mild outliers.
Recall that this robustness is due to the t-distribution's heavier tails compared to the normal distribution, which accounts for extra variability in small samples.
Summarize that the robustness of the t-interval procedure allows statisticians to use it confidently in many practical situations where the normality assumption is approximately but not exactly true.
Verified video answer for a similar problem:
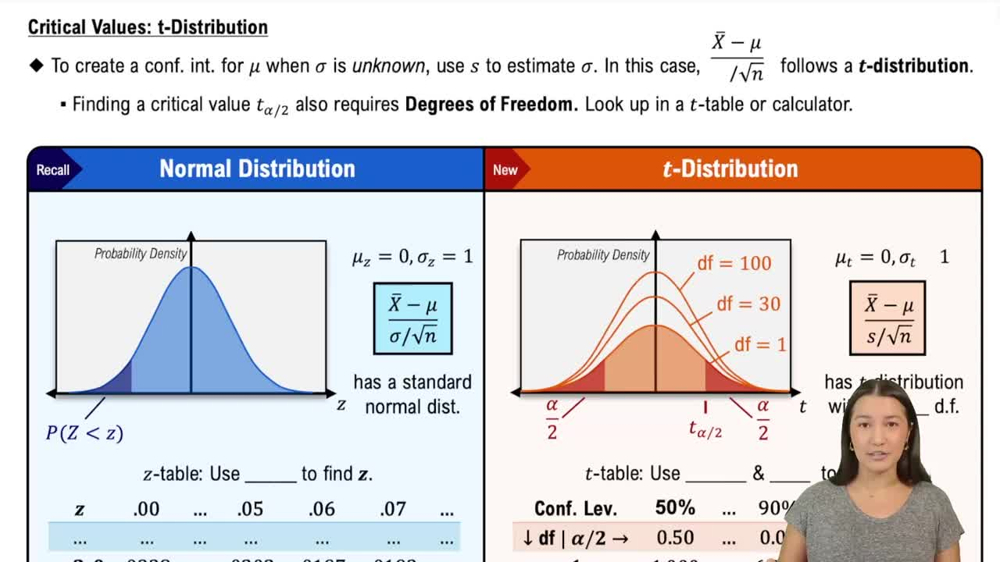
This video solution was recommended by our tutors as helpful for the problem above
Video duration:
2mPlay a video:
Was this helpful?
Key Concepts
Here are the essential concepts you must grasp in order to answer the question correctly.
t-Interval
A t-interval is a confidence interval used to estimate a population mean when the population standard deviation is unknown and the sample size is small. It relies on the t-distribution, which accounts for extra uncertainty compared to the normal distribution.
Recommended video:
Critical Values: t-Distribution
Robustness in Statistics
Robustness refers to a method's ability to produce reliable results even when certain assumptions, like normality of data, are violated. A robust procedure maintains accuracy and validity under a variety of conditions.
Recommended video:
Guided course
Parameters vs. Statistics
Assumptions of the t-Interval
The t-interval assumes that the sample is drawn from a normally distributed population or that the sample size is large enough for the Central Limit Theorem to apply. Robustness means the t-interval still performs well even if these assumptions are mildly violated.
Recommended video:
Critical Values: t-Distribution
Watch next
Master Sampling Distribution of Sample Mean with a bite sized video explanation from Patrick
Start learningRelated Videos
Related Practice
Textbook Question
6
views
