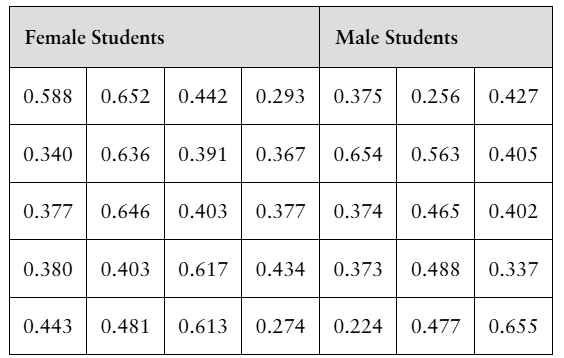
When dealing with two independent means where the population variances are unknown and assumed to be unequal, which statistical test is most appropriate to compare the means?
Table of contents
- 1. Intro to Stats and Collecting Data1h 14m
- 2. Describing Data with Tables and Graphs1h 55m
- 3. Describing Data Numerically2h 5m
- 4. Probability2h 16m
- 5. Binomial Distribution & Discrete Random Variables3h 6m
- 6. Normal Distribution and Continuous Random Variables2h 11m
- 7. Sampling Distributions & Confidence Intervals: Mean3h 23m
- Sampling Distribution of the Sample Mean and Central Limit Theorem19m
- Distribution of Sample Mean - Excel23m
- Introduction to Confidence Intervals15m
- Confidence Intervals for Population Mean1h 18m
- Determining the Minimum Sample Size Required12m
- Finding Probabilities and T Critical Values - Excel28m
- Confidence Intervals for Population Means - Excel25m
- 8. Sampling Distributions & Confidence Intervals: Proportion1h 25m
- 9. Hypothesis Testing for One Sample3h 29m
- 10. Hypothesis Testing for Two Samples4h 50m
- Two Proportions1h 13m
- Two Proportions Hypothesis Test - Excel28m
- Two Means - Unknown, Unequal Variance1h 3m
- Two Means - Unknown Variances Hypothesis Test - Excel12m
- Two Means - Unknown, Equal Variance15m
- Two Means - Unknown, Equal Variances Hypothesis Test - Excel9m
- Two Means - Known Variance12m
- Two Means - Sigma Known Hypothesis Test - Excel21m
- Two Means - Matched Pairs (Dependent Samples)42m
- Matched Pairs Hypothesis Test - Excel12m
- 11. Correlation1h 24m
- 12. Regression1h 50m
- 13. Chi-Square Tests & Goodness of Fit2h 21m
- 14. ANOVA1h 57m
10. Hypothesis Testing for Two Samples
Two Means - Unknown, Unequal Variance
Problem 11.3.14a
Textbook Question
"[DATA] Measuring Reaction Time Researchers wanted to determine whether the reaction time (in seconds) of males differed from that of females to a go/no go stimulus. The researchers randomly selected 20 females and 15 males to participate in the study. The go/no go stimulus required the student to respond to a particular stimulus and not to respond to other stimuli. The results are as follows:
a. Is it reasonable to use Welch’s t-test? Why? Note: Normal probability plots indicate that the data are approximately normal and boxplots indicate that there are no outliers.

Verified step by step guidance1
Step 1: Understand the purpose of Welch's t-test. Welch's t-test is used to compare the means of two independent groups when the assumption of equal population variances is not met. It is a variation of the two-sample t-test that does not assume equal variances.
Step 2: Check the assumptions for using Welch's t-test. According to the problem, the normal probability plots indicate that the data are approximately normal, and the boxplots show no outliers. These conditions satisfy the normality and outlier assumptions required for the test.
Step 3: Assess the equality of variances. Since the problem does not explicitly state that the variances are equal and the sample sizes are different (20 females and 15 males), it is reasonable to suspect that variances might differ. Welch's t-test is appropriate when variances are unequal or unknown.
Step 4: Conclude on the reasonableness of using Welch's t-test. Given that the data are approximately normal, there are no outliers, and the sample sizes differ, it is reasonable to use Welch's t-test to compare the reaction times of males and females.
Step 5: Summarize the justification. Use Welch's t-test because it is robust to unequal variances and different sample sizes, and the data meet the assumptions of normality and lack of outliers, making it a suitable choice for this analysis.
Verified video answer for a similar problem:This video solution was recommended by our tutors as helpful for the problem above
Video duration:
4mPlay a video:
Was this helpful?
Key Concepts
Here are the essential concepts you must grasp in order to answer the question correctly.
Welch’s t-test
Welch’s t-test is a statistical method used to compare the means of two independent groups when the variances are unequal. It adjusts the degrees of freedom to account for this inequality, making it more reliable than the standard t-test under heteroscedasticity. It assumes that the data in each group are approximately normally distributed.
Recommended video:
Critical Values: t-Distribution
Normality Assumption
The normality assumption requires that the data in each group follow a normal distribution, which is important for the validity of many parametric tests, including Welch’s t-test. Normal probability plots help assess this by showing if data points roughly follow a straight line, indicating approximate normality.
Recommended video:
Guided course
Finding Z-Scores for Non-Standard Normal Variables
Outliers and Their Impact
Outliers are extreme values that can distort statistical analyses by affecting means and variances. Boxplots are used to detect outliers visually. The absence of outliers supports the use of parametric tests like Welch’s t-test, as outliers can violate test assumptions and lead to misleading results.
Recommended video:
Guided course
Comparing Mean vs. Median
Watch next
Master Difference in Means: Hypothesis Tests with a bite sized video explanation from Patrick
Start learningRelated Videos
Related Practice
Multiple Choice
12
views
