A simple random sample of size n = 1000 is obtained from a population whose size is N = 1,000,000 and whose population proportion with a specified characteristic is p = 0.35.
c. What is the probability of obtaining x = 320 or fewer individuals with the characteristic?
Verified step by step guidance
1
Identify the parameters of the problem: population size \(N = 1,000,000\), sample size \(n = 1000\), population proportion \(p = 0.35\), and the value of interest \(x = 320\) individuals with the characteristic.
Since the sample size is large and the population is much larger than the sample, approximate the distribution of the number of individuals with the characteristic using a binomial distribution \(X \sim \text{Binomial}(n, p)\).
Calculate the mean and standard deviation of the binomial distribution: the mean is \(\mu = n \times p\) and the standard deviation is \(\sigma = \sqrt{n \times p \times (1 - p)}\).
Use the normal approximation to the binomial distribution to find the probability \(P(X \leq 320)\). Apply the continuity correction by considering \(P(X \leq 320.5)\) for better accuracy.
Convert the value \(320.5\) to a standard normal variable \(Z\) using \(Z = \frac{320.5 - \mu}{\sigma}\), then use standard normal distribution tables or software to find the probability \(P(Z \leq z)\), which approximates \(P(X \leq 320)\).
Verified video answer for a similar problem:
This video solution was recommended by our tutors as helpful for the problem above
Video duration:
6m
Play a video:
0 Comments
Key Concepts
Here are the essential concepts you must grasp in order to answer the question correctly.
Sampling Distribution of the Sample Proportion
The sampling distribution of the sample proportion describes how the proportion of individuals with a characteristic varies across different samples of the same size. For large samples, it is approximately normal with mean equal to the population proportion p and standard deviation depending on p and the sample size n.
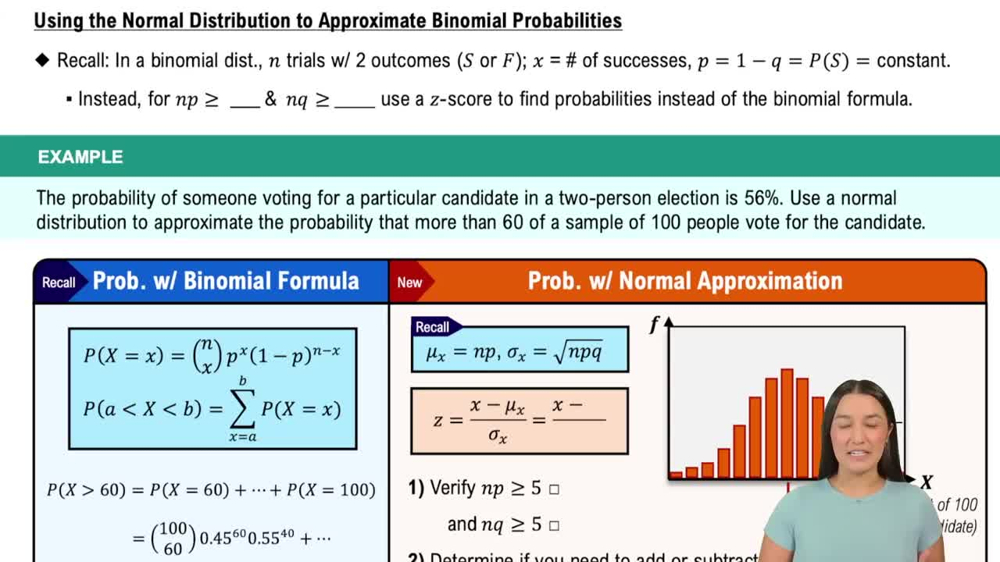
When the sample size is large, the binomial distribution of the number of successes can be approximated by a normal distribution. This simplifies probability calculations, using the mean np and variance np(1-p), especially when np and n(1-p) are both greater than 5.
Using the Normal Distribution to Approximate Binomial Probabilities
Continuity Correction
The continuity correction adjusts for the fact that the binomial distribution is discrete while the normal distribution is continuous. When approximating P(X ≤ x) using the normal distribution, we use P(X ≤ x + 0.5) to improve accuracy.

 Verified step by step guidance
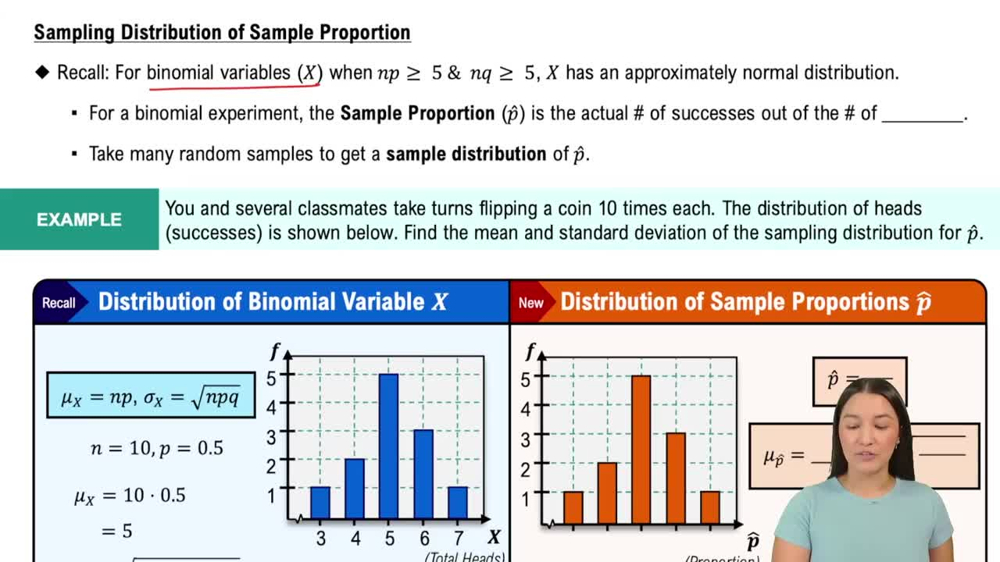
 05:11
05:11