[DATA] Putting It Together: Paternal Smoking It is well-documented that active maternal smoking during pregnancy is associated with lower-birth-weight babies. Researchers wanted to determine if there is a relationship between paternal smoking habits and birth weight. The researchers administered a questionnaire to each parent of newborn infants. One question asked whether the individual smoked regularly. Because the survey was administered within 15 days of birth, it was assumed that any regular smokers were also regular smokers during pregnancy. Birth weights for the babies (in grams) of nonsmoking mothers were obtained and divided into two groups, nonsmoking fathers and smoking fathers. The given data are representative of the data collected by the researchers. The researchers concluded that the birth weight of babies whose father smoked was less than the birth weight of babies whose father did not smoke. g. Draw a side-by-side boxplot of the data. Does the side-by-side boxplot confirm the conclusions of the study?
Verified step by step guidance
1
Step 1: Organize the data into two groups: one for nonsmoking fathers and one for smoking fathers. Each group contains the birth weights of babies whose mothers did not smoke, as given in the table.
Step 2: For each group, calculate the five-number summary, which includes the minimum, first quartile (Q1), median (Q2), third quartile (Q3), and maximum. These values will help in constructing the boxplots.
Step 3: Draw the side-by-side boxplots using the five-number summaries. Each boxplot should display the interquartile range (IQR) as the box, the median as a line inside the box, and whiskers extending to the minimum and maximum values (or to the nearest data points within 1.5 * IQR).
Step 4: Compare the two boxplots by examining the medians, the spread (IQR), and the overall range of birth weights for babies of nonsmoking fathers versus smoking fathers. Look for differences in central tendency and variability.
Step 5: Based on the visual comparison, assess whether the boxplot for babies of smoking fathers tends to show lower birth weights compared to nonsmoking fathers, which would confirm the researchers' conclusion.
Verified video answer for a similar problem:
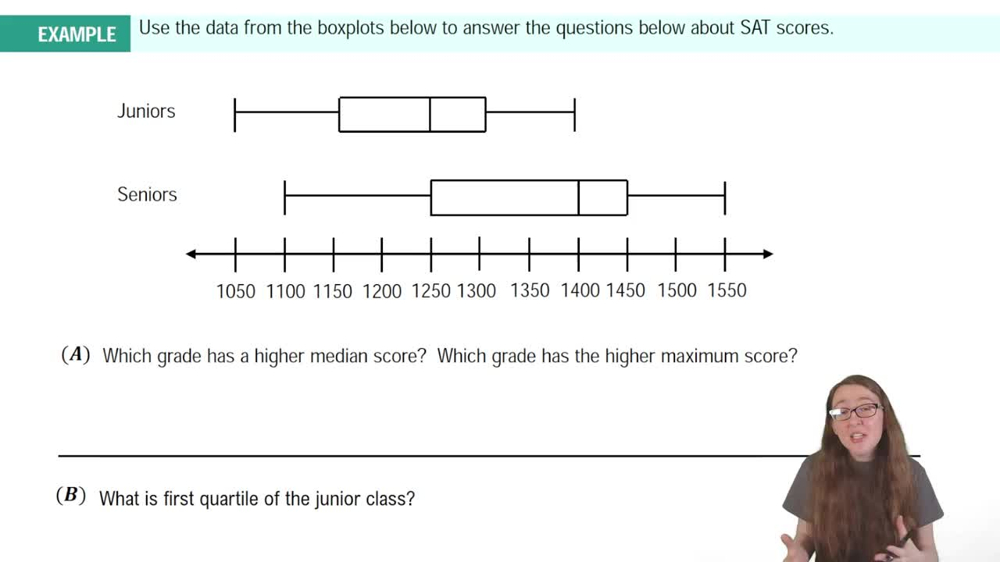
This video solution was recommended by our tutors as helpful for the problem above
Video duration:
2m
Play a video:
0 Comments
Key Concepts
Here are the essential concepts you must grasp in order to answer the question correctly.
Side-by-Side Boxplots
Side-by-side boxplots visually compare the distribution of two or more groups by displaying their medians, quartiles, and potential outliers. They help identify differences in central tendency, spread, and symmetry between groups, making it easier to assess if one group tends to have higher or lower values than another.
Comparing distributions involves analyzing measures like median, interquartile range, and range to understand differences between groups. This helps determine if observed differences, such as birth weights between babies of smoking and nonsmoking fathers, are consistent and meaningful rather than due to random variation.
Confounding variables are factors that may influence both the independent and dependent variables, potentially biasing results. In this study, maternal smoking is controlled by selecting only nonsmoking mothers, isolating the effect of paternal smoking on birth weight to better assess its true impact.