"In Problems 23 through 26, indicate whether a confidence interval for a proportion or mean should be constructed to estimate the value of the variable of interest. Justify your response. A researcher wanted to know whether consumption of green tea on a daily basis reduces LDL (bad) cholesterol. She obtains a random sample of 500 subjects. Each subject consumes at least 1 cup of green tea daily for 1 year. After 1 year, the researcher determines whether the subjects LDL cholesterol decreased, or not."
Verified step by step guidance
1
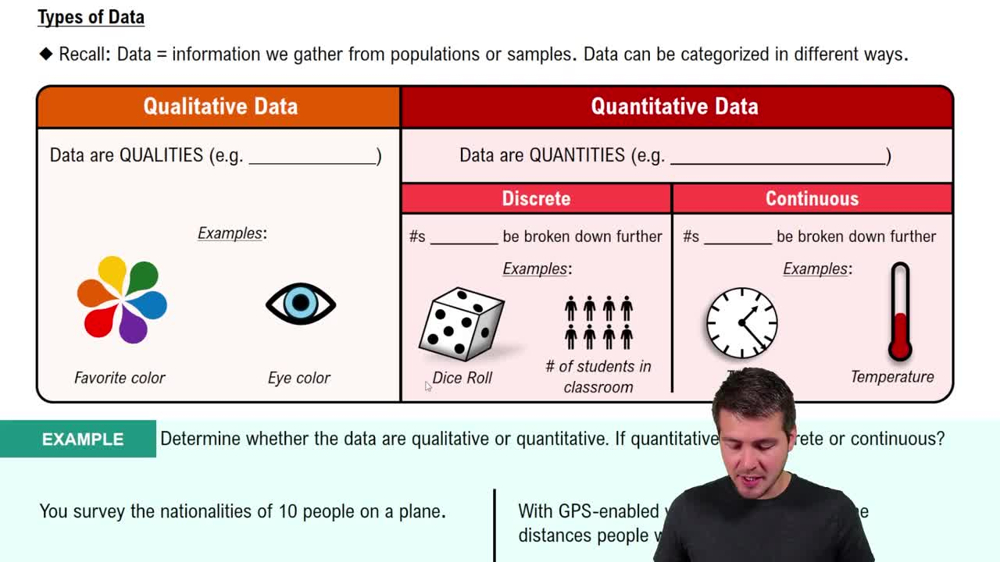
Step 1: Identify the type of variable being measured. Here, the researcher is interested in whether each subject's LDL cholesterol decreased or not, which is a categorical outcome with two possible values: 'decreased' or 'not decreased'.
Step 2: Since the variable of interest is categorical (specifically binary), the parameter to estimate is a proportion — the proportion of subjects whose LDL cholesterol decreased after consuming green tea daily for 1 year.
Step 3: To estimate this proportion, we construct a confidence interval for a population proportion, which provides a range of plausible values for the true proportion of subjects experiencing a decrease in LDL cholesterol.
Step 4: The formula for a confidence interval for a population proportion \(p\) is given by:
\[ \hat{p} \pm z^{*} \sqrt{\frac{\hat{p}(1 - \hat{p})}{n}} \]
where \(\hat{p}\) is the sample proportion, \(n\) is the sample size, and \(z^{*}\) is the critical value from the standard normal distribution corresponding to the desired confidence level.
Step 5: Therefore, the researcher should use the sample data to calculate the sample proportion of subjects with decreased LDL cholesterol and then apply the confidence interval formula for a proportion to estimate the true population proportion.
Verified video answer for a similar problem:
This video solution was recommended by our tutors as helpful for the problem above
Video duration:
2m
Play a video:
0 Comments
Key Concepts
Here are the essential concepts you must grasp in order to answer the question correctly.
Confidence Interval
A confidence interval is a range of values, derived from sample data, that is likely to contain the true population parameter with a specified level of confidence (e.g., 95%). It quantifies the uncertainty around an estimate, such as a mean or proportion, providing a measure of precision.
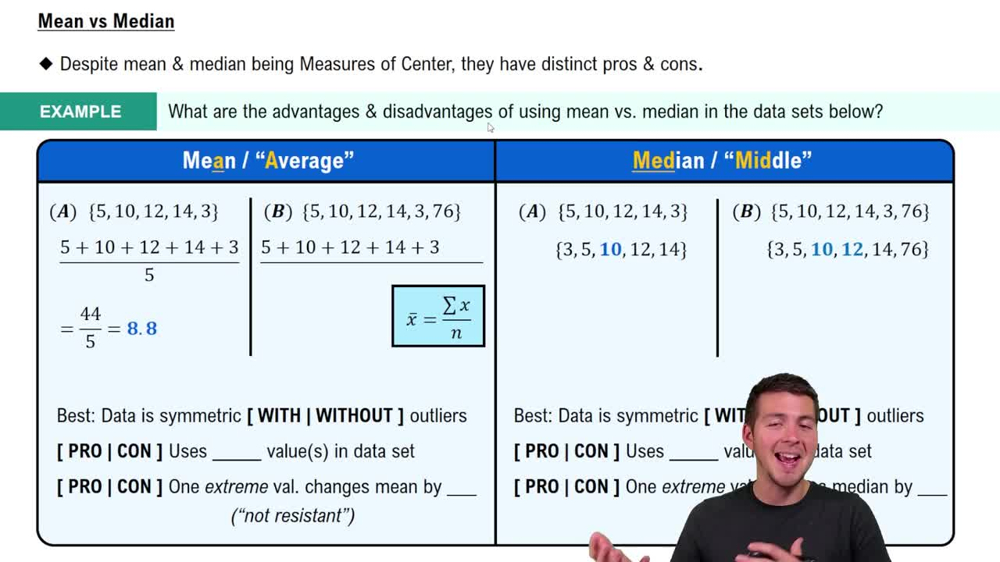
A mean is used to estimate the average value of a quantitative variable, while a proportion estimates the fraction of a population with a certain categorical characteristic. Choosing between them depends on whether the variable of interest is numerical (e.g., cholesterol level) or categorical (e.g., decrease vs. no decrease).
Understanding the type of variable measured (quantitative or categorical) is essential for selecting the correct statistical method. In this case, the outcome is whether LDL cholesterol decreased (a yes/no categorical variable), indicating that a proportion should be estimated rather than a mean.

 Verified step by step guidance
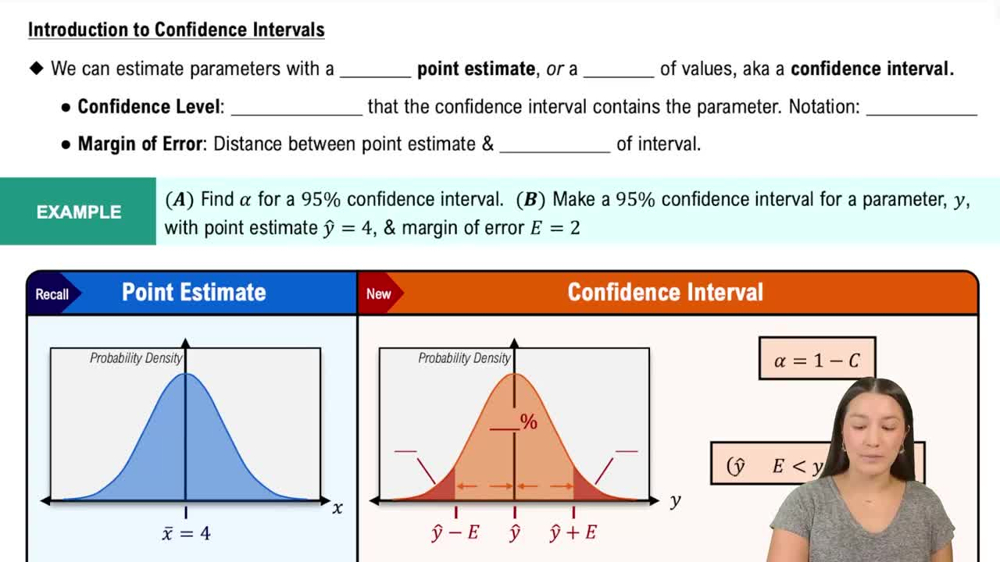
 06:33
06:33