Explain what “95% confidence” means in a 95% confidence interval.
Verified step by step guidance
1
Understand that a 95% confidence interval is a range of values calculated from sample data, which is used to estimate an unknown population parameter, such as a mean or proportion.
Recognize that the term "95% confidence" means that if we were to take many random samples from the same population and compute a confidence interval from each sample, approximately 95% of those intervals would contain the true population parameter.
Note that the confidence level (95%) reflects the long-run success rate of the method used to construct the interval, not the probability that any one specific interval contains the parameter.
Interpret the confidence interval as a statement about the reliability of the estimation process rather than a probability about the parameter itself, since the parameter is fixed and the interval varies from sample to sample.
Summarize by saying that a 95% confidence interval gives us a range that we are "95% confident" includes the true population parameter based on the data and the method used.
Verified video answer for a similar problem:
This video solution was recommended by our tutors as helpful for the problem above
Video duration:
1m
Play a video:
0 Comments
Key Concepts
Here are the essential concepts you must grasp in order to answer the question correctly.
Confidence Interval
A confidence interval is a range of values, derived from sample data, that is likely to contain the true population parameter. It provides an estimated range rather than a single point estimate, reflecting the uncertainty inherent in sampling.
The confidence level, such as 95%, represents the proportion of times that the confidence interval would contain the true population parameter if the same sampling procedure were repeated many times. It quantifies the reliability of the interval estimation.
Saying a 95% confidence interval means that we are 95% confident the interval includes the true parameter. This does not mean there is a 95% probability the parameter lies in the interval for a single sample, but that 95% of such intervals constructed from repeated samples would contain the parameter.

 Verified step by step guidance
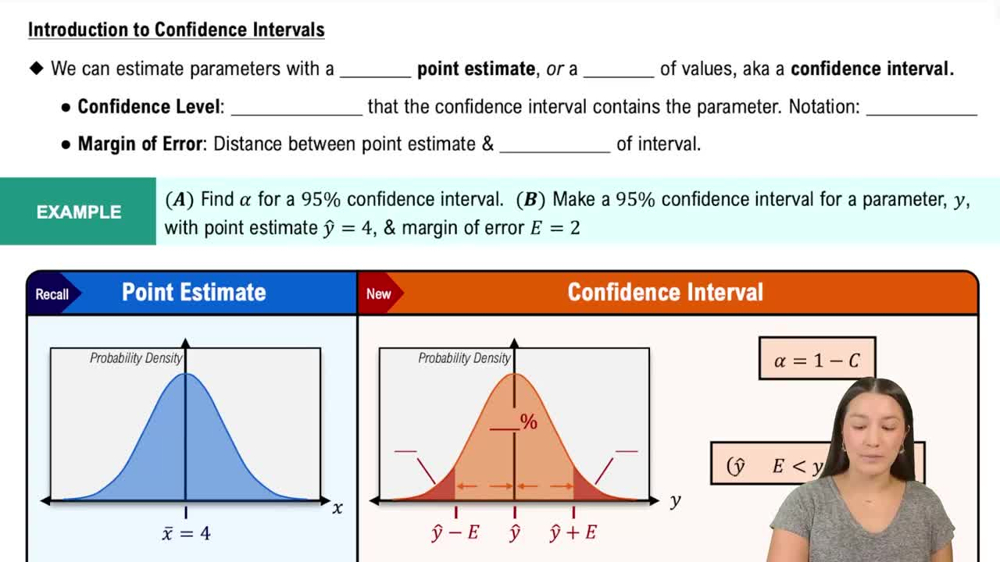
 06:33
06:33