Join thousands of students who trust us to help them ace their exams!
Multiple Choice
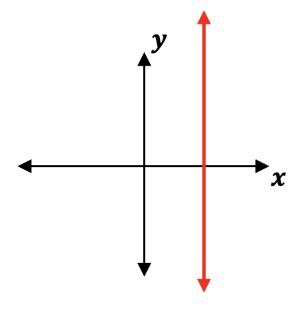
Which of the following graphs below represents the equation ?
A
B
C
D
0 Comments
Verified step by step guidance
1
Understand the equation \(x = 3\). This means that for every point on the graph, the x-coordinate is always 3, regardless of the y-coordinate.
Recognize that the graph of \(x = 3\) is a vertical line crossing the x-axis at 3.
Look at each graph and identify the line that is vertical and passes through the point where \(x = 3\) on the x-axis.
The first two graphs show lines that are slanted, so they do not represent \(x = 3\).
The third graph shows a horizontal line, which represents an equation like \(y = c\), not \(x = 3\). The fourth graph shows a vertical line, which matches the equation \(x = 3\).


 Verified step by step guidance