In the study of genetics, understanding measurements is crucial for analyzing phenotypes, which are observable traits in organisms. To effectively quantify these traits, we often rely on statistical concepts such as the mean, variance, and standard deviation. The mean, or average, is calculated by summing the values of a trait across a sample and dividing by the number of individuals in that sample. For instance, if we measure the tail length of 100 lizards, we would add all their tail lengths together and divide by 100 to find the mean tail length.
When discussing populations, it's important to differentiate between the population mean and sample mean. A population includes all individuals of a species in a defined area, while a sample is a smaller, representative subset of that population. Care must be taken when selecting samples to ensure they accurately reflect the broader population, as biased samples can lead to misleading conclusions.
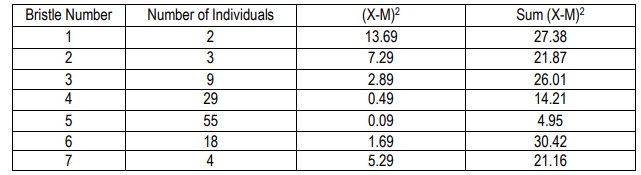
Variance is another key concept, measuring how much individual values differ from the mean. It is calculated by taking the difference between each individual value and the mean, squaring that difference, summing these squared differences, and then dividing by the number of observations minus one (n - 1). This provides insight into the distribution of traits within a population. For example, if the mean number of spots on Dalmatians is 100, and one individual has 73 spots, variance helps quantify how much variation exists among all individuals measured.
Standard deviation, closely related to variance, measures the amount of variation or dispersion in a set of data. It is derived from variance by taking the square root of the variance value. This statistic is particularly useful for understanding the spread of data points around the mean. In contrast, standard error assesses how accurately the sample mean estimates the population mean, accounting for potential sampling errors.
These statistical measures often appear in the context of a normal distribution, commonly represented as a bell curve. This graphical representation illustrates how traits are distributed within a population, showing the frequency of different values. The peak of the curve indicates the most common trait value, while the width of the curve reflects the variance. A narrow curve suggests that most individuals have traits close to the mean, while a wider curve indicates greater variability among individuals.
In summary, mastering these statistical concepts is essential for analyzing genetic data and understanding the variation in phenotypes across populations. By applying these measurements, researchers can draw meaningful conclusions about the traits of organisms and their distributions in nature.