Ch 19: The First Law of Thermodynamics
Young & Freedman Calc - University Physics 14th Edition
Young & Freedman Calc14th EditionUniversity PhysicsISBN: 9780321973610Not the one you use?Change textbook
Chapter 19, Problem 7a

In Fig. 19.719.7a, consider the closed loop 132411 → 3 → 2 → 4 → 1. This is a cyclic process in which the initial and final states are the same. Find the total work done by the system in this cyclic process, and show that it is equal to the area enclosed by the loop.
Graph illustrating three paths from state 1 to state 2 with labeled points.

Verified step by step guidance
1
Identify the cyclic process in the PV diagram. The process follows the path 1 → 3 → 2 → 4 → 1, forming a closed loop.
Recall that the work done by a system in a PV diagram is represented by the area enclosed by the process path. For a cyclic process, this is the area inside the loop.
To find the area, note that the loop is a rectangle with vertices at (V1, P1), (V2, P1), (V2, P2), and (V1, P2).
Calculate the area of the rectangle using the formula: Area = (V2 - V1) * (P1 - P2). This represents the total work done by the system in the cyclic process.
Conclude that the total work done by the system in this cyclic process is equal to the area enclosed by the loop, as shown by the calculation.

Verified video answer for a similar problem:

This video solution was recommended by our tutors as helpful for the problem above.
Video duration:
5m
Was this helpful?

Key Concepts

Here are the essential concepts you must grasp in order to answer the question correctly.

Cyclic Process

A cyclic process is a thermodynamic process in which a system returns to its initial state after a series of changes. In such processes, the internal energy of the system remains constant, and any work done by or on the system can be calculated by analyzing the path taken in a pressure-volume (P-V) diagram. The total work done in a cyclic process is represented by the area enclosed by the path on the P-V diagram.
Recommended video:
Guided course
08:45
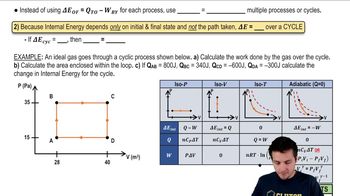
Properties of Cyclic Thermodynamic Processes

Work Done in Thermodynamics

In thermodynamics, the work done by a system during a process can be calculated as the integral of pressure with respect to volume. For a closed loop in a P-V diagram, the work done is equal to the area enclosed by the path. This area can be positive or negative depending on the direction of the process, but in a cyclic process, the net work done is the total area enclosed, reflecting the energy transferred during the cycle.
Recommended video:
Guided course
07:44
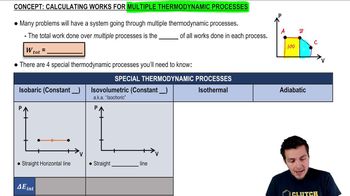
Calculating Works For Multiple Thermodynamic Processes

Area Under the Curve

The area under a curve in a P-V diagram represents the work done during a thermodynamic process. For a cyclic process, the area enclosed by the path taken from the initial state back to itself indicates the net work done by the system. This concept is crucial for visualizing and calculating work in various thermodynamic cycles, such as the Carnot cycle or the Otto cycle, where different paths can yield different amounts of work despite starting and ending at the same state.
Recommended video:
Guided course
04:05
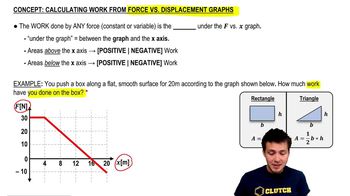
Calculating Work As Area Under F-x Graphs
Related Practice
Textbook Question

Five moles of an ideal monatomic gas with an initial temperature of 127127°C expand and, in the process, absorb 15001500 J of heat and do 21002100 J of work. What is the final temperature of the gas?

2210
views

Textbook Question

A gas undergoes two processes. In the first, the volume remains constant at 0.2000.200 m3 and the pressure increases from 2.00×1052.00\(\times\)10^5 Pa to 5.00×1055.00\(\times\)10^5 Pa. The second process is a compression to a volume of 0.1200.120 m3 at a constant pressure of 5.00×1055.00\(\times\)10^5 Pa. Find the total work done by the gas during both processes.

2420
views
2
rank
Textbook Question

A gas in a cylinder expands from a volume of 0.1100.110 m3 to 0.3200.320 m3 . Heat flows into the gas just rapidly enough to keep the pressure constant at 1.65×1051.65\(\times\)10^5 Pa during the expansion. The total heat added is 1.15×1051.15\(\times\)10^5 J. Find the work done by the gas.

1752
views
Textbook Question

The graph in Fig. E19.419.4 shows a pVpV-diagram of the air in a human lung when a person is inhaling and then exhaling a deep breath. Such graphs, obtained in clinical practice, are normally somewhat curved, but we have modeled one as a set of straight lines of the same general shape. (Important: The pressure shown is the gauge pressure, not the absolute pressure.) The process illustrated here is somewhat different from those we have been studying, because the pressure change is due to changes in the amount of gas in the lung, not to temperature changes. (Think of your own breathing. Your lungs do not expand because they've gotten hot.) If the temperature of the air in the lung remains a reasonable 20 20°C, what is the maximum number of moles in this person's lung during a breath?

2075
views
Textbook Question

Figure E19.819.8 shows a pVpV-diagram for an ideal gas in which its absolute temperature at bb is one-fourth of its absolute temperature at aa. Did heat enter or leave the gas from aa to bb? How do you know?

2562
views
Textbook Question

A gas undergoes two processes. In the first, the volume remains constant at 0.2000.200 m3 and the pressure increases from 2.00×1052.00\(\times\)10^5 Pa to 5.00×1055.00\(\times\)10^5 Pa. The second process is a compression to a volume of 0.1200.120 m3 at a constant pressure of 5.00×1055.00\(\times\)10^5 Pa. In a pVpV-diagram, show both processes.

1457
views