



Ch. 3 - Describing, Exploring, and Comparing Data
Triola - Elementary Statistics 14th Edition
Triola14th EditionElementary StatisticsISBN: 9780137366446Not the one you use?Change textbook
Chapter 3, Problem 3.2.37

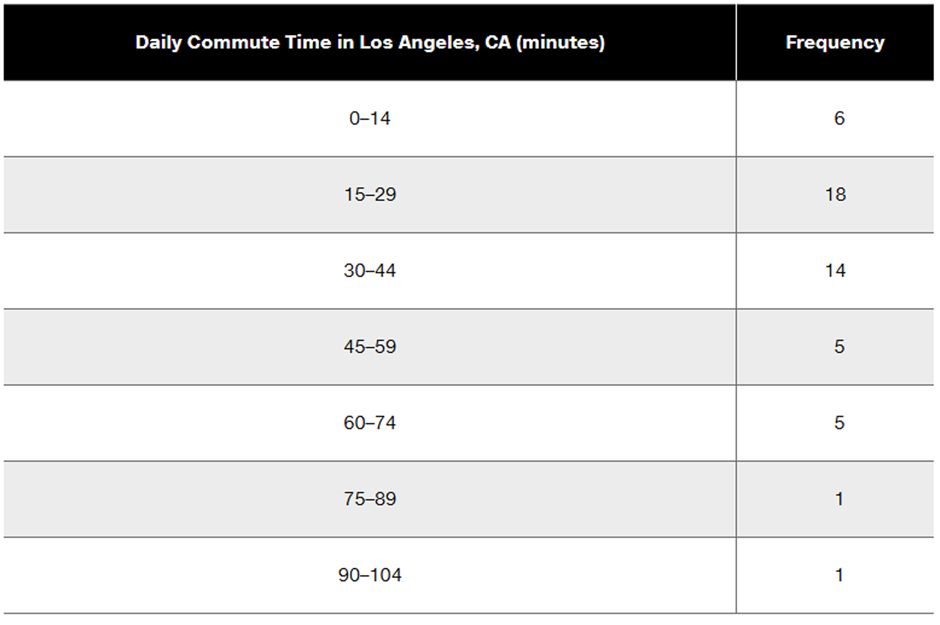
Finding Standard Deviation from a Frequency Distribution. In Exercises 37–40, refer to the frequency distribution in the given exercise and compute the standard deviation by using the formula below, where x represents the class midpoint, f represents the class frequency, and n represents the total number of sample values. Also, compare the computed standard deviations to these standard deviations obtained by using Formula 3-4 with the original list of data values: (Exercise 37) 18.5 minutes; (Exercise 38) 36.7 minutes; (Exercise 39) 6.9 years; (Exercise 40) 20.4 seconds.


Standard deviation for frequency distribution


Standard deviation formula for frequency distribution, showing variables n, f, and x.


Table showing daily commute times in Los Angeles, CA, with frequency counts for each time interval in minutes.

Verified step by step guidance
1
Step 1: Compute the class midpoints for each interval. The class midpoint is calculated as the average of the lower and upper boundaries of each class. For example, for the interval 0–14, the midpoint is (0 + 14) / 2 = 7. Repeat this for all intervals.
Step 2: Multiply each class midpoint by its corresponding frequency to compute the product f * x for each class. Then, sum all these products to find Σ(f * x).
Step 3: Square each class midpoint to compute x² for each class. Multiply these squared midpoints by their corresponding frequencies to compute f * x² for each class. Then, sum all these products to find Σ(f * x²).
Step 4: Calculate the total number of sample values, n, by summing all the frequencies. For example, n = 6 + 18 + 14 + 5 + 5 + 1 + 1.
Step 5: Use the formula for the standard deviation: s = sqrt((n * Σ(f * x²) - (Σ(f * x))²) / (n * (n - 1))). Substitute the values of n, Σ(f * x), and Σ(f * x²) into the formula and simplify to compute the standard deviation.

Verified video answer for a similar problem:

This video solution was recommended by our tutors as helpful for the problem above.
Video duration:
8m
Was this helpful?

Key Concepts

Here are the essential concepts you must grasp in order to answer the question correctly.

Standard Deviation

Standard deviation is a measure of the amount of variation or dispersion in a set of values. It quantifies how much the values in a dataset deviate from the mean. A low standard deviation indicates that the values tend to be close to the mean, while a high standard deviation indicates a wider spread of values.
Recommended video:
Guided course
08:45
Calculating Standard Deviation

Frequency Distribution

A frequency distribution is a summary of how often each value occurs in a dataset. It organizes data into classes or intervals, showing the number of observations (frequency) within each class. This representation helps in understanding the distribution and patterns within the data, making it easier to calculate statistics like the mean and standard deviation.
Recommended video:
Guided course
06:38
Intro to Frequency Distributions

Class Midpoint

The class midpoint is the value that lies in the middle of a class interval in a frequency distribution. It is calculated by averaging the upper and lower boundaries of the class. The midpoints are used in the standard deviation formula to represent the data points within each class, allowing for a more accurate calculation of dispersion in grouped data.
Recommended video:
04:15
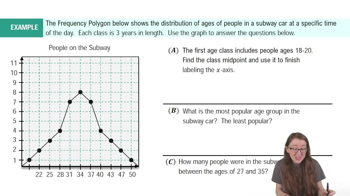
Frequency Polygons Example 1
Related Practice
Textbook Question

Significant Values. In Exercises 9–12, use the range rule of thumb to identify (a) the values that are significantly low, (b) the values that are significantly high, and (c) the values that are neither significantly low nor significantly high.


IQ Scores The Wechsler test is used to measure intelligence of adults aged 16 to 80. The mean test score is 100 and the standard deviation is 15.

222
views
Textbook Question

Comparing Values. In Exercises 13–16, use z scores to compare the given values.


Tallest and Shortest Men The tallest adult male was Robert Wadlow, and his height was 272 cm. The shortest adult male was Chandra Bahadur Dangi, and his height was 54.6 cm. Heights of men have a mean of 174.12 cm and a standard deviation of 7.10 cm. Which of these two men has the height that is more extreme?

293
views
Textbook Question

In Exercises 21–28, use the same list of cell phone radiation levels given for Exercises 17–20. Find the indicated percentile or quartile.


Q3


149
views
Textbook Question

Boxplots. In Exercises 29–32, use the given data to construct a boxplot and identify the 5-number summary.


Blood Pressure Measurements Fourteen different second-year medical students at Bellevue Hospital measured the blood pressure of the same person. The systolic readings (mm Hg) are listed below.


138 130 135 140 120 125 120 130 130 144 143 140 130 150

197
views
Textbook Question

z Scores If your score on your next statistics test is converted to a z score, which of these z scores would you prefer: -2.00, -1.00, 0, 1.00, 2.00? Why?

319
views
Textbook Question

Estimating Standard Deviation with the Range Rule of Thumb. In Exercises 29–32, refer to the data in the indicated exercise. After finding the range of the data, use the range rule of thumb to estimate the value of the standard deviation. Compare the result to the standard deviation computed using all of the data.


Audiometry Use the hearing measurements from Data Set 7 “Audiometry.” Does it appear that the amounts of variation are different for the right threshold measurements and the left threshold measurements?

301
views