Comparing z-Scores from Different Data Sets The table shows population statistics for the ages of Best Actor and Best Supporting Actor winners at the Academy Awards from 1929 to 2020. The distributions of the ages are approximately bell-shaped. In Exercises 51–54, compare the z-scores for the actors.
Best Actor 1970: John Wayne, Age: 62 Best Supporting Actor 1970: Gig Young, Age: 56
Verified step by step guidance
1
Step 1: Understand the z-score formula. The z-score is calculated using the formula: , where is the observed value, is the mean, and is the standard deviation.
Step 2: Identify the values for Best Actor (John Wayne). The observed age is 62 years, the mean age is approximately 43.8 years, and the standard deviation is approximately 8.7 years.
Step 3: Calculate the z-score for Best Actor using the formula: . Simplify the numerator and divide by the standard deviation.
Step 4: Identify the values for Best Supporting Actor (Gig Young). The observed age is 56 years, the mean age is approximately 50.2 years, and the standard deviation is approximately 13.5 years.
Step 5: Calculate the z-score for Best Supporting Actor using the formula: . Simplify the numerator and divide by the standard deviation.
Verified video answer for a similar problem:
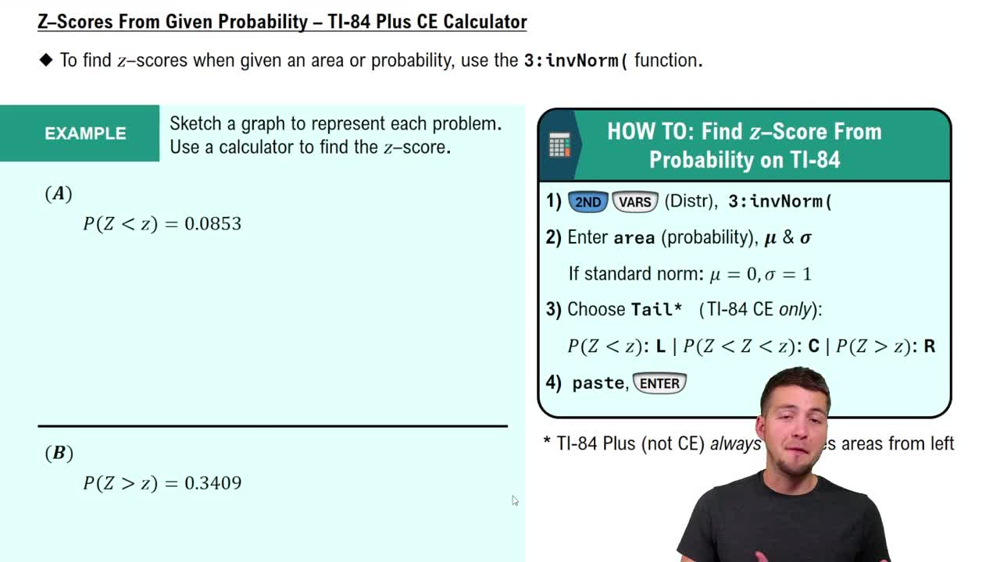
This video solution was recommended by our tutors as helpful for the problem above
Video duration:
6m
Play a video:
0 Comments
Key Concepts
Here are the essential concepts you must grasp in order to answer the question correctly.
Z-Score
A z-score measures how many standard deviations an individual data point is from the mean of a dataset. It is calculated by subtracting the mean from the data point and then dividing by the standard deviation. Z-scores allow for comparison between different datasets by standardizing values, making it easier to identify how unusual or typical a particular observation is within its distribution.
Z-Scores From Given Probability - TI-84 (CE) Calculator
Mean (μ)
The mean, often represented by the symbol μ (mu), is the average value of a dataset, calculated by summing all the data points and dividing by the number of points. It provides a central value around which the data tends to cluster. In the context of the question, the means for Best Actor and Best Supporting Actor ages are essential for calculating their respective z-scores.
Standard deviation, denoted by σ (sigma), quantifies the amount of variation or dispersion in a dataset. A low standard deviation indicates that the data points tend to be close to the mean, while a high standard deviation suggests a wider spread of values. Understanding standard deviation is crucial for interpreting z-scores, as it is a key component in their calculation, reflecting the variability of ages among the award winners.