
College Skills The Collegiate Learning Assessment Plus is an exam that is meant to assess the intellectual gains made between one’s freshman and senior year of college. The exam, graded on a scale of 400 to 1600, assesses critical thinking, analytical reasoning, document literacy, writing, and communication. The exam was administered to 135 freshman in Fall 2012 at California State University Long Beach (CSULB). The mean score on the exam was 1191 with a standard deviation of 187. The exam was also administered to graduating seniors of CSULB in Spring 2013. The mean score was 1252 with a standard deviation of 182. Explain the type of analysis that could be applied to these data to assess whether CLA+ scores increase while at CSULB. Explain the shortcomings in the data available and provide a better data collection technique.
10. Hypothesis Testing for Two Samples
Two Means - Known Variance
Problem 11.T.8b
Textbook Question
In a study conducted to determine the role that sleep disorders play in academic performance, researcher Jane Gaultney conducted a survey of 1845 college students to determine if they had a sleep disorder (such as narcolepsy, insomnia, or restless leg syndrome). Of the 503 students with a sleep disorder, the mean grade point average was 2.65 with a standard deviation of 0.87. Of the 1342 students without a sleep disorder, the mean grade point average was 2.82 with a standard deviation of 0.83. Source: SLEEP 2010: Associated Professional Sleep Societies 24th Annual Meeting.
b. Is there evidence to suggest sleep disorders adversely affect one’s GPA at the α=0.05 level of significance?
 Verified step by step guidance
1
Step 1: Define the hypotheses for the test. The null hypothesis \(H_0\) assumes that there is no difference in mean GPA between students with and without sleep disorders, i.e., \(\mu_1 = \mu_2\). The alternative hypothesis \(H_a\) suggests that students with sleep disorders have a lower mean GPA, i.e., \(\mu_1 < \mu_2\).
Step 2: Identify the sample statistics and sizes. For students with sleep disorders: sample size \(n_1 = 503\), mean \(\bar{x}_1 = 2.65\), standard deviation \(s_1 = 0.87\). For students without sleep disorders: sample size \(n_2 = 1342\), mean \(\bar{x}_2 = 2.82\), standard deviation \(s_2 = 0.83\).
Step 3: Choose the appropriate test. Since we are comparing the means of two independent samples with known sample standard deviations, and the sample sizes are large, a two-sample z-test or t-test for the difference of means can be used. Typically, a two-sample t-test is appropriate here.
Step 4: Calculate the test statistic using the formula for the difference between two means:
\[
t = \frac{\bar{x}_1 - \bar{x}_2}{\sqrt{\frac{s_1^2}{n_1} + \frac{s_2^2}{n_2}}}
\]
This formula measures how many standard errors the observed difference in means is away from zero under the null hypothesis.
Step 5: Determine the degrees of freedom for the t-test using the Welch-Satterthwaite equation:
\[
df = \frac{\left(\frac{s_1^2}{n_1} + \frac{s_2^2}{n_2}\right)^2}{\frac{\left(\frac{s_1^2}{n_1}\right)^2}{n_1 - 1} + \frac{\left(\frac{s_2^2}{n_2}\right)^2}{n_2 - 1}}
\]
Then, compare the calculated t-statistic to the critical t-value from the t-distribution table at \(\alpha = 0.05\) for a one-tailed test. If the test statistic falls in the rejection region, reject the null hypothesis, indicating evidence that sleep disorders adversely affect GPA.
Verified video answer for a similar problem:This video solution was recommended by our tutors as helpful for the problem above
Video duration:
8mKey Concepts
Here are the essential concepts you must grasp in order to answer the question correctly.
Hypothesis Testing
Hypothesis testing is a statistical method used to decide whether there is enough evidence to reject a null hypothesis in favor of an alternative hypothesis. In this context, it involves testing if the mean GPA differs between students with and without sleep disorders, using a significance level (α) of 0.05 to control the probability of a Type I error.
Recommended video:

 05:52
05:52Performing Hypothesis Tests: Proportions
Two-Sample t-Test for Means
A two-sample t-test compares the means of two independent groups to determine if they are statistically different. Here, it assesses whether the average GPA of students with sleep disorders is significantly lower than that of students without, accounting for sample sizes, means, and standard deviations.
Recommended video:
 06:53
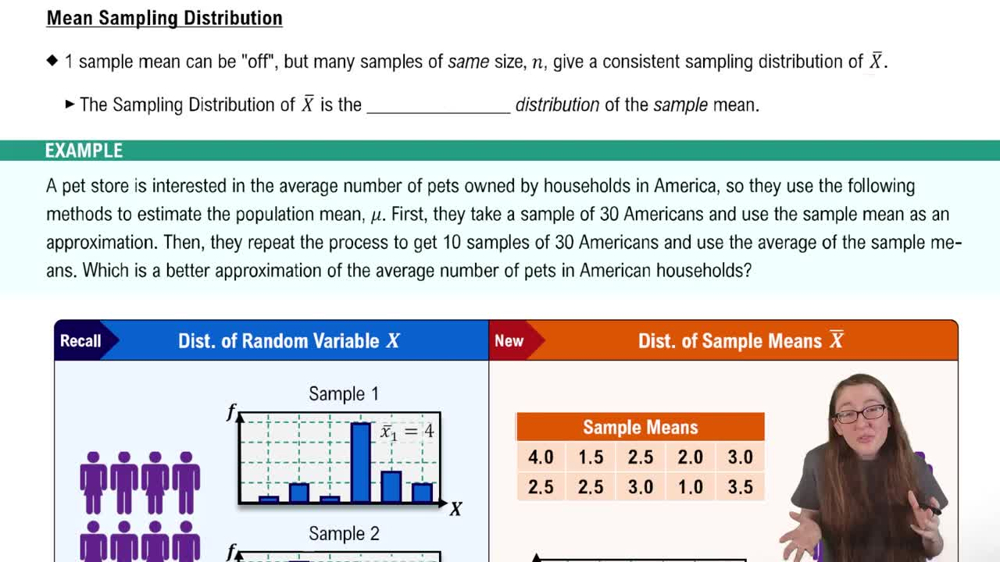
06:53Sampling Distribution of Sample Mean
Significance Level and p-Value
The significance level (α) is the threshold for rejecting the null hypothesis, commonly set at 0.05. The p-value measures the probability of observing the data if the null hypothesis is true. If the p-value is less than α, it suggests strong evidence against the null, indicating sleep disorders may adversely affect GPA.
Recommended video:
Guided course
 06:50
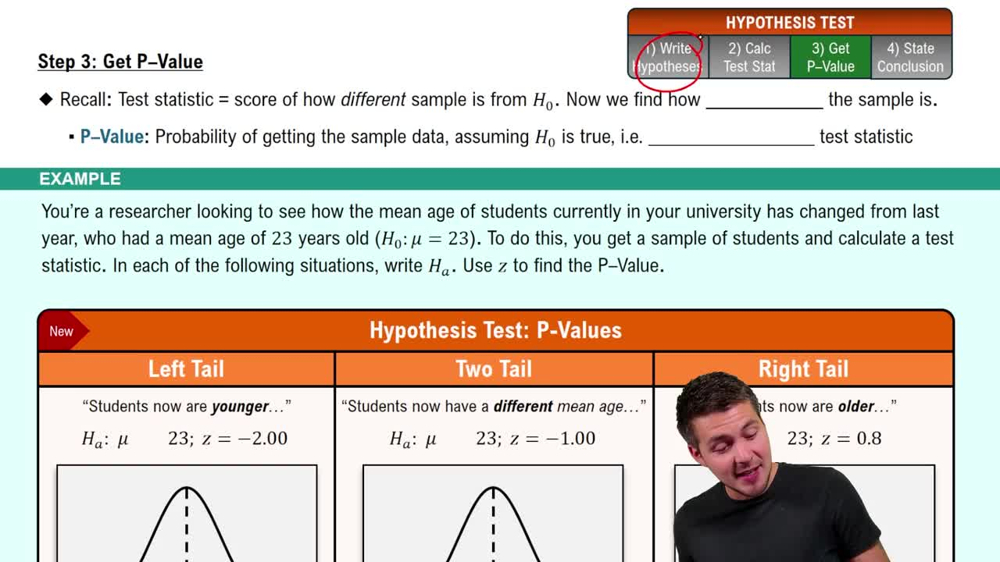
06:50Step 3: Get P-Value
Related Videos
Related Practice
Textbook Question
42
views