
Bribe ‘em with Chocolate In a study published in the journal Teaching of Psychology, the article “Fudging the Numbers: Distributing Chocolate Influences Student Evaluations of an Undergraduate Course” states that distributing chocolate to students prior to teacher evaluations increases results. The authors randomly divided three sections of a course taught by the same instructor into two groups. Fifty of the students were given chocolate by an individual not associated with the course and 50 of the students were not given chocolate. The mean score from students who received chocolate was 4.2, while the mean score for the nonchocolate groups was 3.9. Suppose that the sample standard deviation of both the chocolate and nonchocolate groups was 0.8. Does chocolate appear to improve teacher evaluations? Use the α = 0.01 level of significance.
10. Hypothesis Testing for Two Samples
Two Means - Known Variance
Problem 8.1.28
Textbook Question
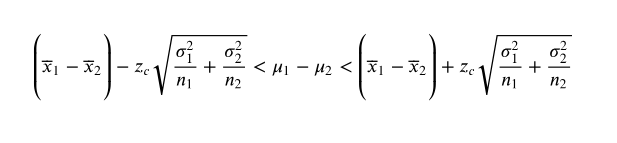
Testing a Difference Other Than Zero Sometimes a researcher is interested in testing a difference in means other than zero. In Exercises 27 and 28, you will test the difference between two means using a null hypothesis of Ho: μ1-μ2=k, Ho: μ1-μ2>=k or Ho: μ1-μ2<=k . The standardized test statistic is still

Architect Salaries Is the difference between the mean annual salaries of entry level architects in Denver, Colorado, and Lincoln, Nebraska, equal to \$9000? To decide, you select a random sample of entry level architects from each city. The results of each survey are shown in the figure. Assume the population standard deviations are σ1=\$6560 and σ2=\$6100 . At α=0.01 what should you conclude? (Adapted from Salary.com)
 Verified step by step guidance
1
Step 1: Identify the null hypothesis (H0) and alternative hypothesis (Ha). Here, the null hypothesis is that the difference in mean salaries between Denver and Lincoln is \$9000, so H0: \( \mu_1 - \mu_2 = 9000 \). The alternative hypothesis depends on the research question, but typically it could be \( \mu_1 - \mu_2 \neq 9000 \) for a two-tailed test.
Step 2: Gather the sample statistics and population standard deviations. From the problem, we have \( \bar{x}_1 = 58300 \), \( n_1 = 32 \), \( \sigma_1 = 6560 \) for Denver, and \( \bar{x}_2 = 54240 \), \( n_2 = 30 \), \( \sigma_2 = 6100 \) for Lincoln.
Step 3: Calculate the test statistic using the formula for the difference between two means with known population standard deviations: \(\n\[\n\)\( Z = \frac{(\bar{x}_1 - \bar{x}_2) - k}{\sqrt{\frac{\sigma_1^2}{n_1} + \frac{\sigma_2^2}{n_2}}} \)\(\n\]\nwhere\) \( k = 9000 \) is the hypothesized difference.
Step 4: Determine the critical value \( z_c \) for the significance level \( \alpha = 0.01 \). Since this is likely a two-tailed test, find the z-value that corresponds to \( \alpha/2 = 0.005 \) in each tail of the standard normal distribution.
Step 5: Use the confidence interval formula provided to check if the hypothesized difference \( k = 9000 \) lies within the confidence interval bounds: \(\n\[\n\)\( \left( (\bar{x}_1 - \bar{x}_2) - z_c \sqrt{\frac{\sigma_1^2}{n_1} + \frac{\sigma_2^2}{n_2}} , (\bar{x}_1 - \bar{x}_2) + z_c \sqrt{\frac{\sigma_1^2}{n_1} + \frac{\sigma_2^2}{n_2}} \right) \)\(\n\]\nIf\) 9000 is outside this interval, reject the null hypothesis; otherwise, do not reject it.
Verified video answer for a similar problem:This video solution was recommended by our tutors as helpful for the problem above
Video duration:
5mKey Concepts
Here are the essential concepts you must grasp in order to answer the question correctly.
Hypothesis Testing for Difference in Means
This involves testing whether the difference between two population means equals a specific value (not necessarily zero). The null hypothesis can be stated as H0: μ1 - μ2 = k, where k is the hypothesized difference. The alternative hypothesis tests if the difference is greater than, less than, or not equal to k.
Recommended video:
Guided course
 08:24
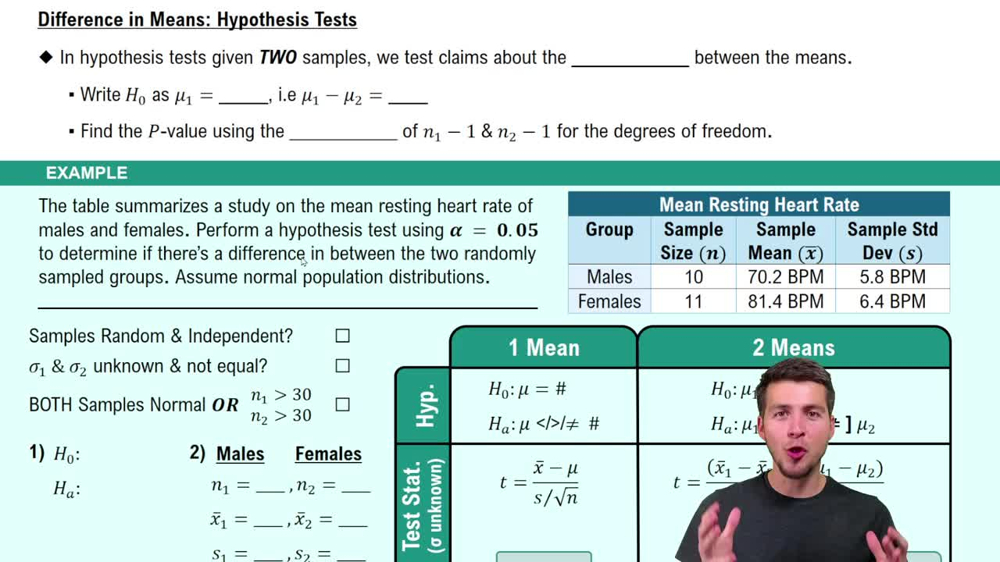
08:24Difference in Means: Hypothesis Tests
Standardized Test Statistic for Two Means
The test statistic for comparing two means with known population standard deviations is calculated by subtracting the hypothesized difference from the sample mean difference, then dividing by the standard error of the difference. This statistic follows a normal distribution under the null hypothesis.
Recommended video:
Guided course
08:24Difference in Means: Hypothesis Tests
Significance Level and Decision Rule
The significance level (α) defines the threshold for rejecting the null hypothesis. For α=0.01, the critical value corresponds to the 99% confidence level. If the test statistic falls in the rejection region beyond this critical value, the null hypothesis is rejected, indicating a statistically significant difference.
Recommended video:
 03:53
03:53Conditional Probability Rule
Related Videos
Related Practice
Textbook Question
22
views