Join thousands of students who trust us to help them ace their exams!
Multiple Choice
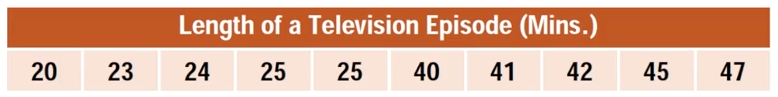
Using the data in the table below, compute Q1 and Q3.
A
&
B
&
C
&
D
&
1 Comment
Verified step by step guidance
1
Step 1: Organize the data in ascending order. The table already provides the data sorted in ascending order, which is crucial for calculating percentiles and quartiles.
Step 2: To find P50 (the 50th percentile, also known as the median), locate the middle value of the dataset. If the dataset has an odd number of values, the median is the middle value. If the dataset has an even number of values, the median is the average of the two middle values.
Step 3: To determine the percentile of a playlist with 15 songs, use the formula: Percentile = ((Number of values below the given value) / Total number of values) × 100. Count how many values are below 15 in the dataset and apply the formula.
Step 4: To find Q1 (the first quartile), locate the value at the 25th percentile. This is the median of the lower half of the dataset (excluding the overall median if the dataset has an odd number of values).
Step 5: To find Q3 (the third quartile), locate the value at the 75th percentile. This is the median of the upper half of the dataset (excluding the overall median if the dataset has an odd number of values).


 Verified step by step guidance
